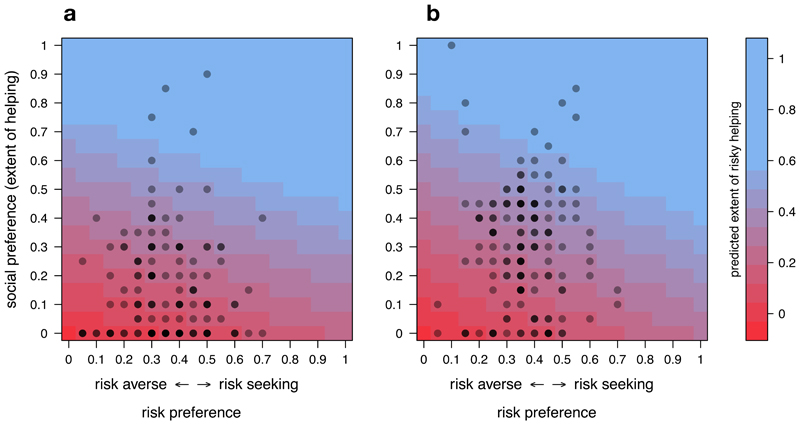
Figure 3. Predicting risky helping.
Plot showing the predicted extent of risky helping (color surface) based on a linear combination of risk preference and social preference in Study 1 (a) and Study 2 (b). Dots show the observed risk (x-axis) and social preference (y-axis) of deciders. Darker dots indicate that multiple deciders had the same risk and social preference profile.

