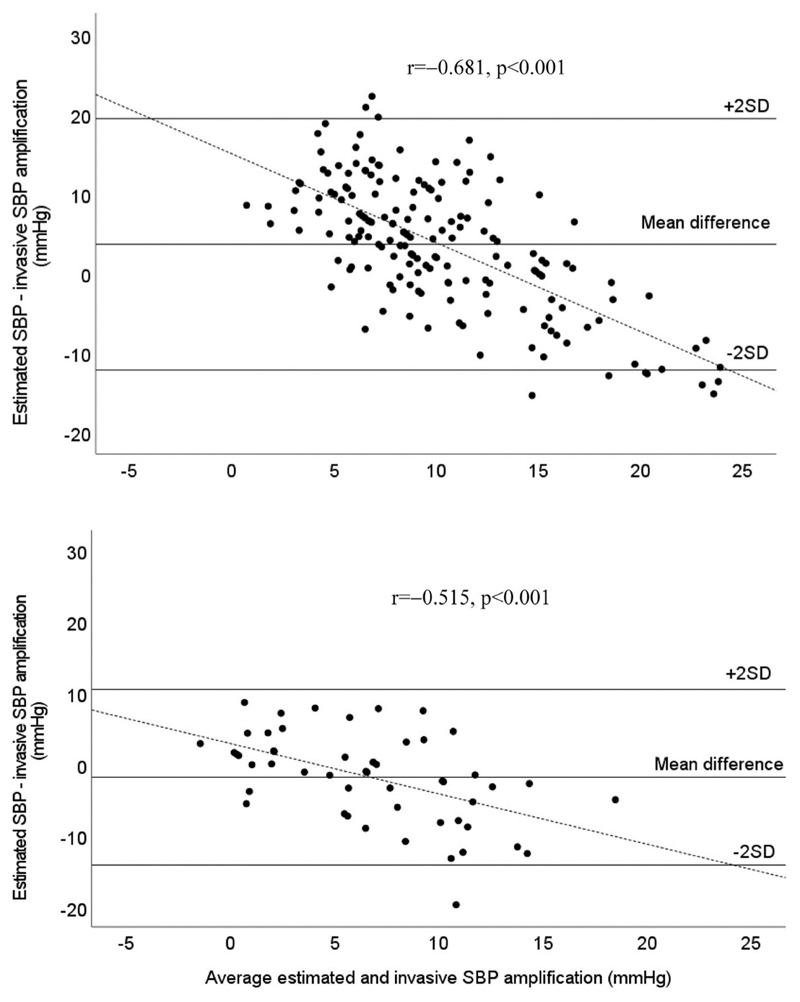
Figure 1.
Bland–Altman plot of difference between estimated SBP and invasive SBP amplification from device 1 (Sphygmocor Xcel, top) and device 2 (Uscom BP+, bottom). Dashed line is the line of best fit. Solid lines are mean difference and ±2 SDs of the difference between estimated and invasive SBP amplification. Bland-Altman plots indicate evidence of systematic bias for greater underestimation of SBP amplification with increasing level of SBP amplification, but with stronger bias observed for device 1 (r = −0.68 vs. r = −0.52; z = 2.72; P = 0.008).

