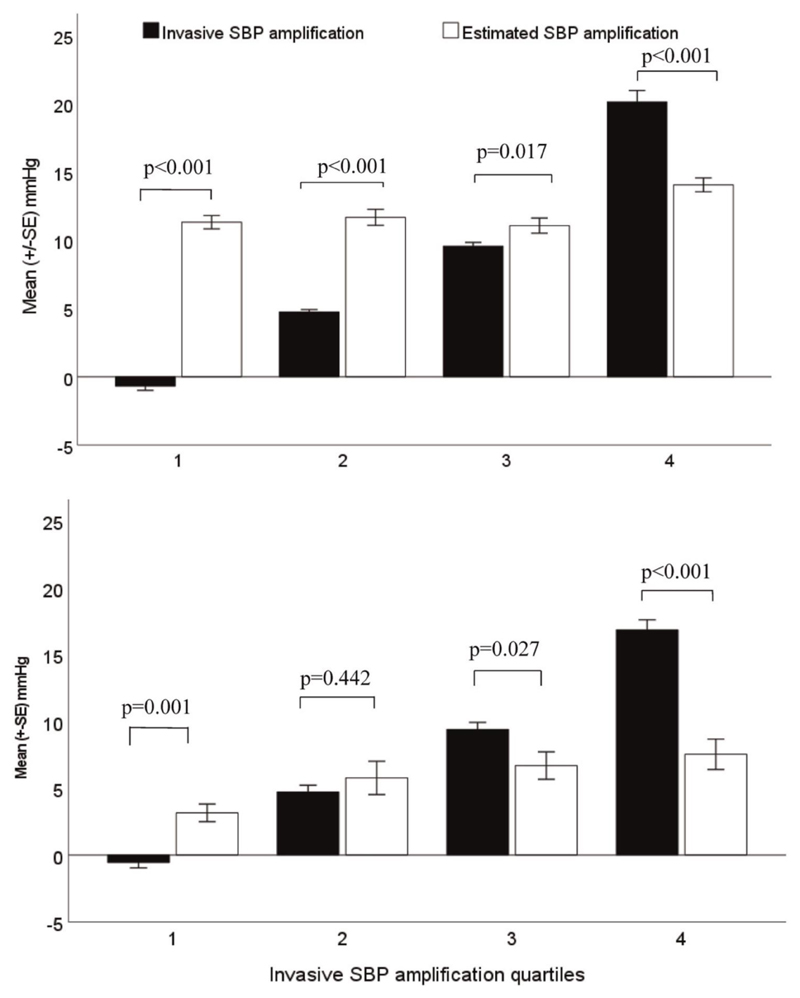
Figure 2.
Bar plots (mean ± SE) of estimated SBP amplification (white bars) and invasive SBP amplification (black bars) per invasive SBP amplification quartiles from device 1 (Sphygmocor Xcel, top) and device 2 (Uscom BP+, bottom). From these figures, there was a stepwise increase in mean invasive SBP amplification for each of elevated invasive SBP quartile (Ptrend < 0.001) whilst estimated SBP amplification was overestimated at the first quartiles (P ≤ 0.001, for all) and underestimated at the highest quartile (P < 0.001, for all).

