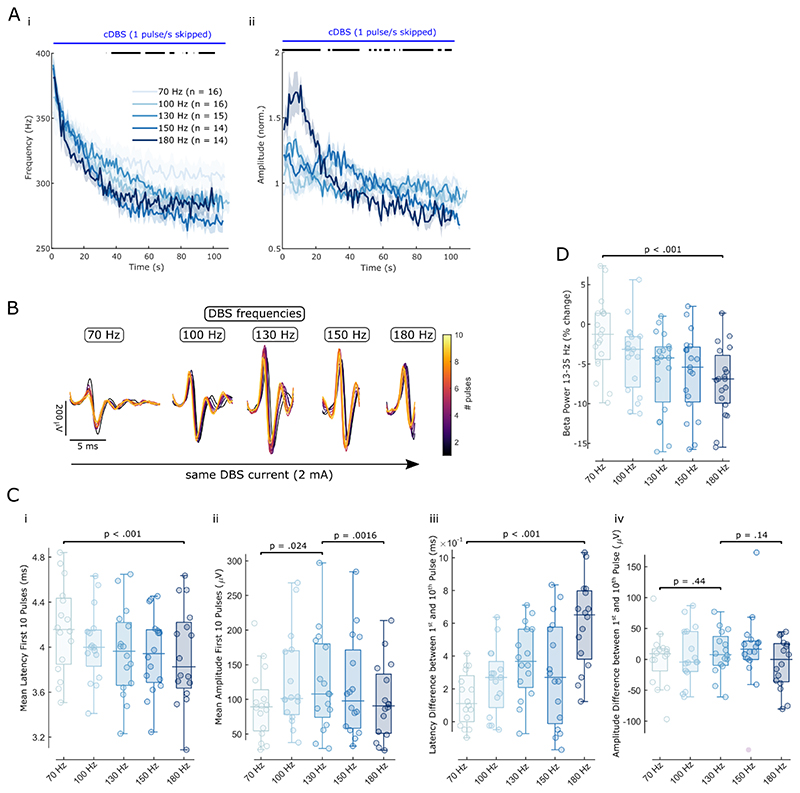
Figure 5. ERNA dynamics are modulated by different DBS frequencies.
A. The slow dynamics of time series-based ERNA frequencies (i) and amplitudes (ii) are differently affected by increasing DBS frequencies over the first 100 s of stimulation. Bars above the plots denote significant clusters of a one-way ANOVA after multiple comparison correction. B. ERNA after the first 10 pulses of DBS blocks of increasing DBS frequency (shown for one example subject at 2 mA). C. Fast ERNA latency (i+iii) and amplitude (ii+iv) dynamics (of the first 10 pulses) are differently affected by increasing DBS frequencies. D. Beta power suppression during DBS relative to a 30 s baseline before the respective blocks becomes stronger with increasing DBS frequencies. C and D show p-values of linear mixed-effect models.

