
Figure 2.
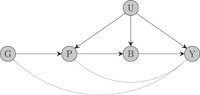
Directed acyclic graph illustrating why pleiotropic bias is less likely in MR studies of protein expression than in studies using downstream phenotypic traits as risk factors. Here, denotes the genetic instrument, protein expression, the downstream biomarker, the outcome and denotes confounding factors. Both types of MR studies are affected by pleiotropy due to “direct” effects of the genetic instrument on the outcome ( pathway), but standard MR analyses are also subject to pleiotropy due to potential effects of the protein on the outcome ( pathway) which is not the case for studies of disease progression. MR, Mendelian randomization.