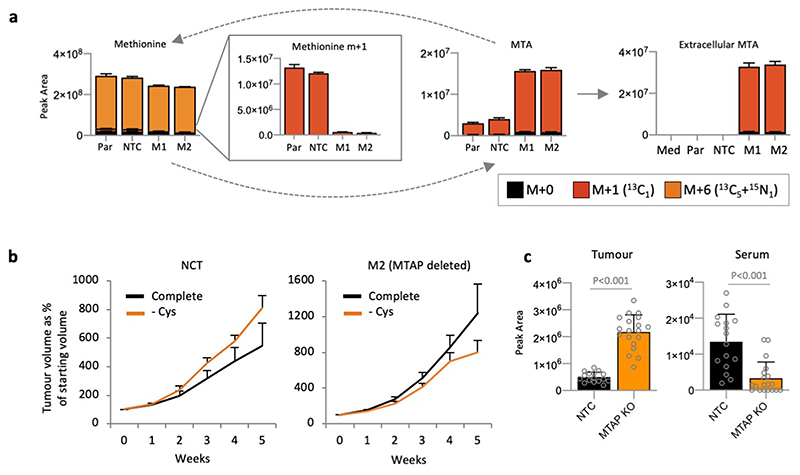
Extended Data Fig. 8. Consequences of acute MTAP deletion in HCT116 cells.
(a) MTAP positive (Parental/Par, NTC) and negative (M1, M2) HCT116 cells were grown in complete medium (with 13C515N1-methionine 0.2mM substituted for methionine) for 30h. Metabolites were extracted and analysed by LCMS. Data are averages of n=3 biological replicates with error bars as SD. (b) CD-1 Nude mice were injected with MTAP positive (NTC) and MTAP deleted (M2) HCT116 cells. Once measurable xenograft tumours had formed, mice were transferred to a diet & drinking water regime either containing all amino acids (Complete), or lacking cysteine and cystine, but containing all other amino acids (-Cys), data are averages, bars are SEM (NTC Control diet n=8, NTC –Cys diet n=7, MTAP-KO2 Control diet n=9, MTAP-KO2 –Cys n=10). (c) Metabolites were extracted from xenograft tumours and serum and subjected to LCMS analysis for MTA levels, data are averages, bars are SD, unpaired Ttest, 2-tails, NTC n=16, MTAP KO n=19.

