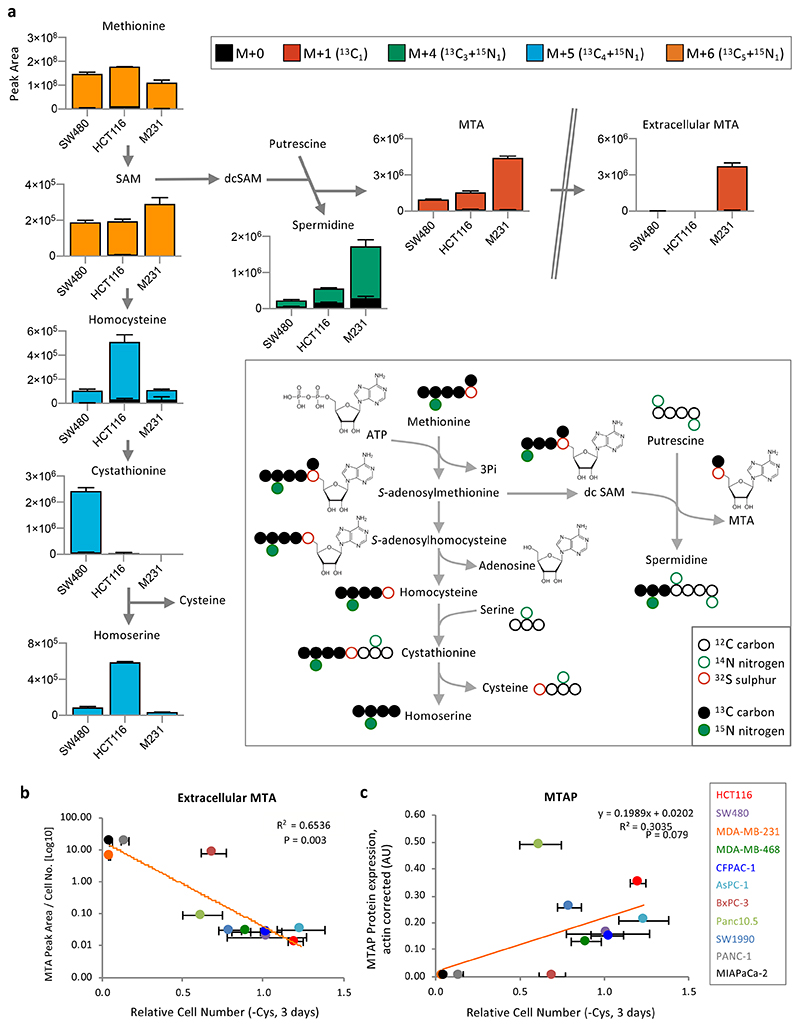
Figure 2. Methylthioadenosine efflux correlates with sensitivity to cysteine starvation.
(a) HCT116, SW480 and MDA-MB-231 (M231) cells were grown in complete medium (with 13C515N1-methionine 0.2mM substituted for methionine) for 48h. Metabolites were extracted and analysed by LCMS. Peaks for S-adenosylhomocysteine (SAH) were not detected by LCMS in this analysis. (b) The panel of 11 cancer cell lines shown in Fig.1a were grown in complete medium. Spent media samples were collected after 24h and analysed by LCMS. MTA peak area (normalized for cell number) is plotted versus the relative cell numbers after cysteine starvation shown in Fig. 1a. (c) MTAP protein expression was detected by western blot, quantified with a LiCor scanner and normalized to actin expression (see Extended Data Fig. 3a) and plotted versus cell number as described for Fig. 1f. Trendlines and Pearson correlation coefficients are shown on the scatter plots. P-value = two-sided Student’s t-distribution. LCMS data are averages of n=3 biological replicates, error bars are SD.

