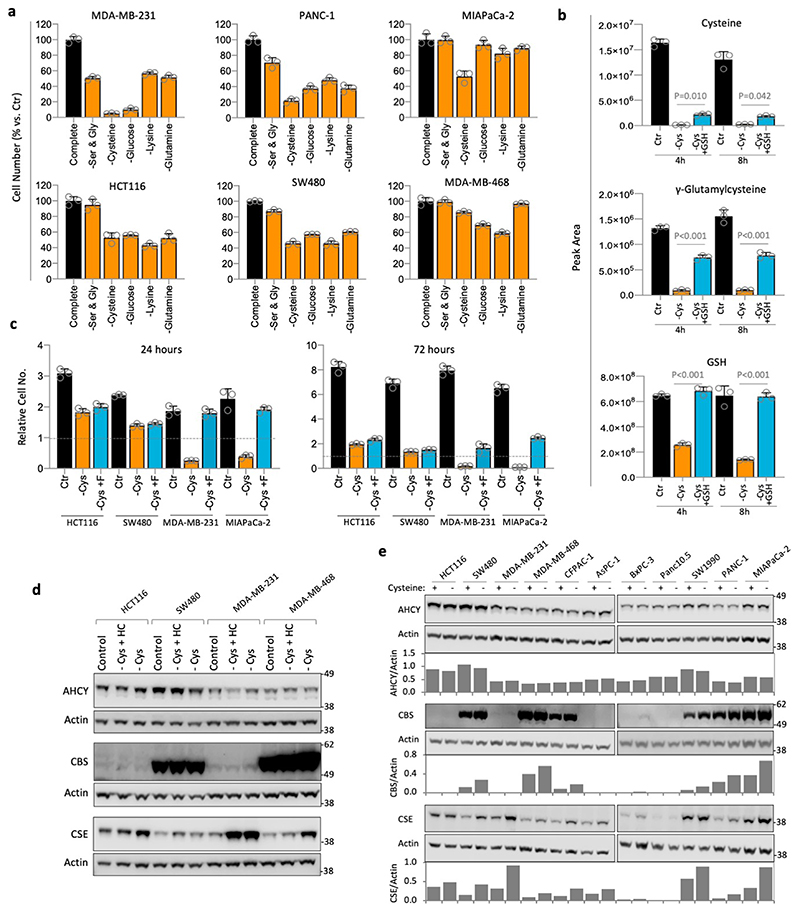
Extended Data Fig. 1. Cellular response to cysteine starvation.
(a) Cell lines were grown in complete medium, or matched medium lacking the stated nutrients for 24h. MDA-MB-231 data is replicated from Fig.1b for comparison with other cell lines. (b) MDA-MB-231 cells were either grown in complete medium containing all amino acids (Ctr), or matched medium lacking cysteine, with (-Cys +GSH) or without (-Cys) glutathione 5mM for the stated times. Metabolites were extracted and analysed by LCMS. (c) Cell lines were grown with (Ctr) or without cysteine (-Cys) and Ferrostatin (+F) 1μM for 24h and 72h. (d) Colorectal (HCT116 & SW480) and breast (MDA-MB-231 & MDA-MB-468) cancer cells were either grown in complete medium containing all amino acids (Control), or matched medium lacking cysteine, with (-Cys +HC) or without (-Cys) homocysteine 0.8mM for 24h. Cell lysates were probed for transsulfuration pathway enzyme expression by western blot. (e) Cells were either grown in complete medium containing all amino acids (+), or matched medium lacking cysteine (-) for 24h. Cell lysates were probed for transsulfuration pathway enzyme expression by western blot. Western blots are representative of two independent experiments. Bands were quantified on a LiCor scanner, actin corrected band intensity (arbitrary units) are shown. Statistical comparisons in b were done by an ordinary one-way ANOVA with Sidak’s multiple comparison test. Other than western blots, all data are averages of n=3 biological replicates, error bars are SD.

