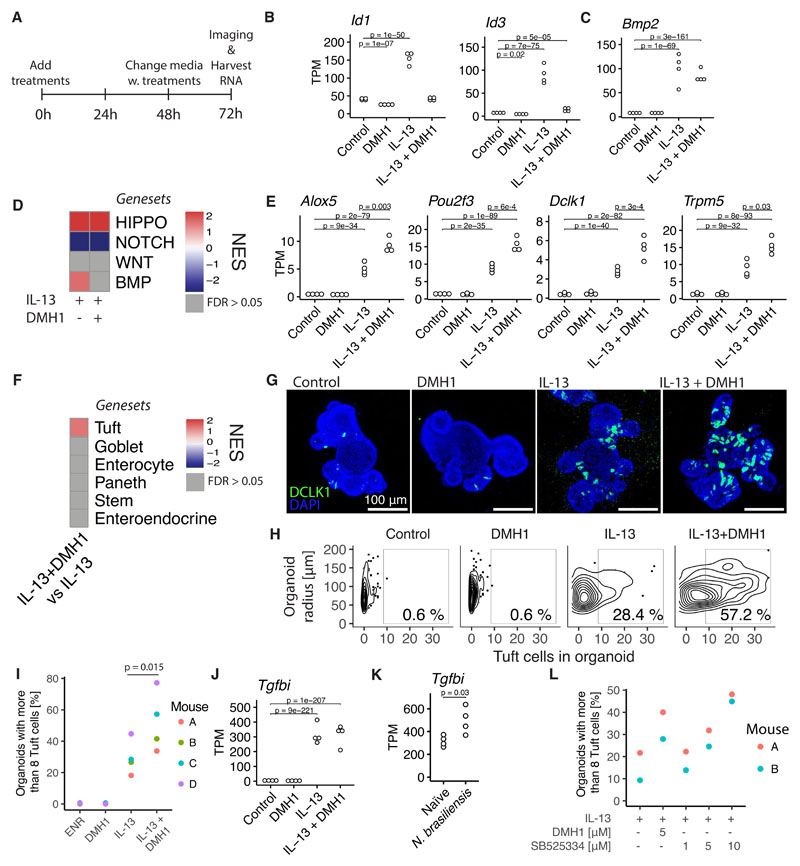
Figure 4. BMP signaling restricts IL-13-induced tuft cell expansion.
A, Time points since seeding for RNAseq experiment from small intestinal organoids treated with 10 ng/mL cytokine and 5 μM DMH1 for 72 hours. B,C, Gene expression determined with RNAseq as described in A. Each circle is one biological replicate and statistics calculated with DESeq2, see methods. D, Heatmap of NES values from GSEA of gene sets representing signaling pathways in indicated treatments vs control condition. See supplementary file 1 for exact gene sets. E, see B. F, Heatmap of NES values from GSEA of gene sets representing cell types from Haber et al. in IL-13 + DMH1 treated organoids vs IL-13 organoids. See supplementary file 1 for exact gene sets. G, Confocal staining of DCLK1 in small intestinal organoids treated with indicated treatments for 72 hours. Images are projections of Z-stacks. H, Manual quantification of same experiment as G, plot represents a total of 566 organoids. I, Percentage determined as in H where each circle is a biological replicate from independent experiments. p-value determined with a paired T-test. J, See B. K, Gene expression in intestinal epithelium extracted from mice infected with N. brasiliensis determined with RNAseq. Each circle is one biological replicate and statistics calculated with DESeq2, see methods. L, Percentage of organoids with more than 8 tuft cells. Determined in similar fashion as in previous figures (see G,H and I) except that this is automatic tuft cell counts. Each circle is one biological replicate. Representative of two experiments. DMH1 inhibits ALK2 and SB525334 inhibits ALK5. TPM = transcripts per million, NES = Normalized Enrichment Score.

