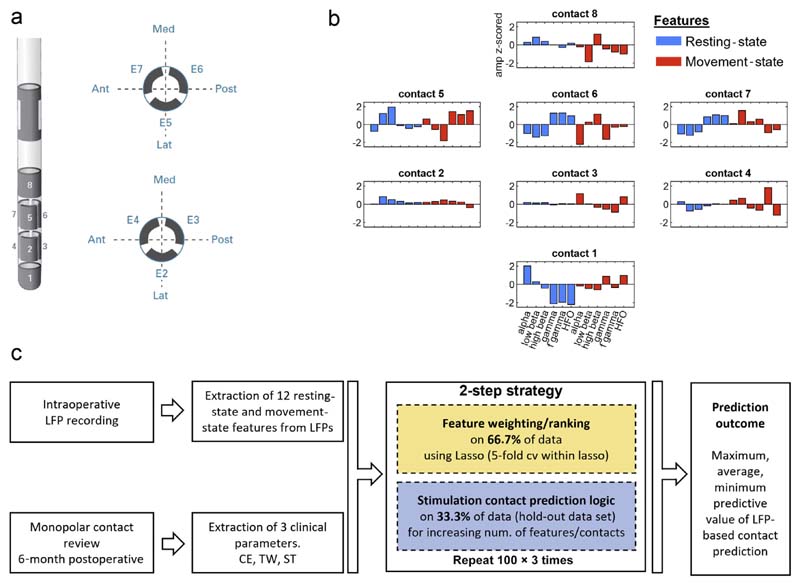
Figure 1. Method figure.
a. Illustrates the directional DBS lead (Boston Scientific). Contacts are distributed along four levels. On levels two and three, there are three segmented contacts (level two: contacts 2/3/4; level three: contacts 5/6/7). b. For each contact, the resting state power- and movement-related modulation was derived for the following frequency bands: alpha (8–12 Hz), low beta (13–20 Hz), high beta (21–30 Hz), gamma (60–90 Hz), fast gamma (105–145 Hz), HFO (205–395 Hz). Hemisphere number 20 was selected as example to illustrate the heterogenous distribution of the features across the eight stimulation contacts (z-scoring of the amplitude performed separately for each feature category across the eight contacts). c. Flow chart summarizing the two-step strategy to validate the contact prediction performance. Ant, anterior; Med, medial; Post, posterior; Lat, lateral. [Color figure can be viewed at www.neuromodulationjournal.org]

