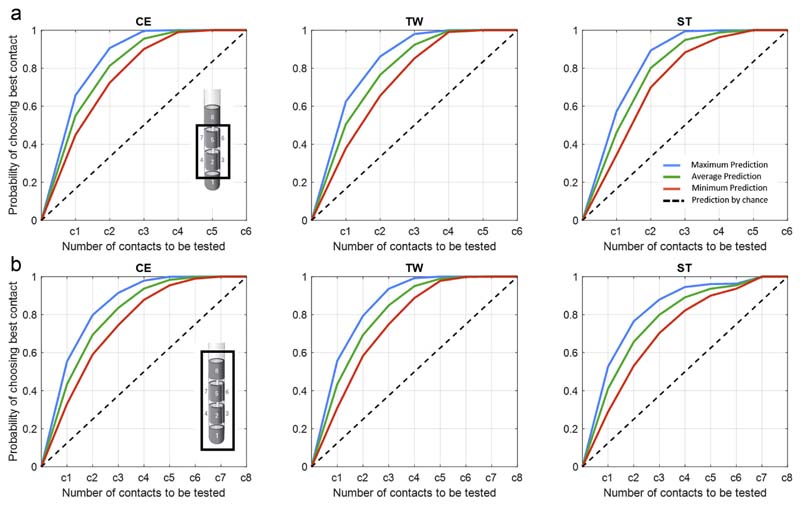
Figure 6. LFP-based prediction of the clinically best upper 30 percentile contacts.
Illustrates the output of the second step of the contact prediction method, corresponding to the probability of identifying one of the best stimulation contacts for the three clinical parameters (CE,TW, ST) of the six segmented contacts (a) and of all eight contacts (b). In contrast to Figures 4a and 5a, in which the probability of identifying the highest ranked stimulation contact is illustrated, the current figure illustrates the probability of identifying one of the upper 30 percentile of the best contacts. Within each subplot, the maximum, average, and minimum prediction accuracies evaluated on the hold-out set of nine hemispheres are illustrated as mean value, averaged across the multiple iteration of the prediction pipeline (Fig. 1). The dashed black lines illustrate the prediction by chance (conventional gold standard test strategy), where the probability of identifying the most efficient stimulation contact increases by 0.17 (in a) and 0.125 (in b) after each contact tested. By applying the LFP-based contact prediction strategy, after considering up to half of the electrophysiologically ranked stimulation contacts, the probability of identifying one the best stimulation contacts can reach a maximum as follows: for segmented contacts (a) EF: 99.7%, TW: 98.0, and SE: 99.5%; for all contacts (b) EF: 97.9%, TW: 99.2%, and SE: 94.6%. [Color figure can be viewed at www.neuromodulationjournal.org]

