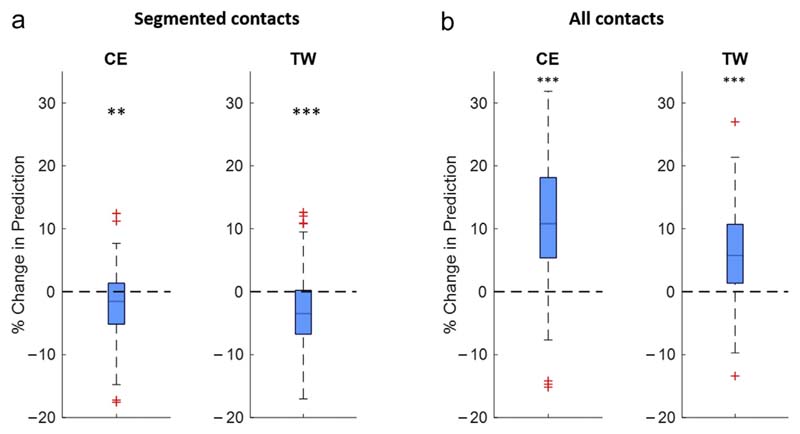
Figure 8. LFP-based contact prediction combined with anatomy.
This illustrates the percentage change of the prediction performance when adding an anatomical landmark of the dorsal STN (ie, stimulation sweet spot for low stimulation ET) as feature to the prediction algorithm. The prediction performance is again illustrated as change in the area under the curve for the first three of six segmented contacts (a) and four of eight contacts (b) of the combined approach (LFP + anatomical landmark) relative to the LFP approach alone. This anatomical reference point has been validated on the ET, used to calculate both CE and TW; therefore, results are indicated for those two clinical parameters. When only the six centered segmented contacts are considered (a), adding the anatomical landmark as feature to the prediction leads to a slight deterioration of the prediction performance without beneficial effect in most instances (median: CE: −1.5, TW: −3.48%). When the entire DBS lead is considered (b), combining LFP features with the anatomical landmark leads to a significant increase of the prediction performance (median: CE: 10.8%, TW 5.8%). One-sampled t-tests (false discovery rate corrected); **p < 0.01; ***p < 0.001. Detailed statistics in the Supplementary Material. [Color figure can be viewed at www.neuromodulationjournal.org]

