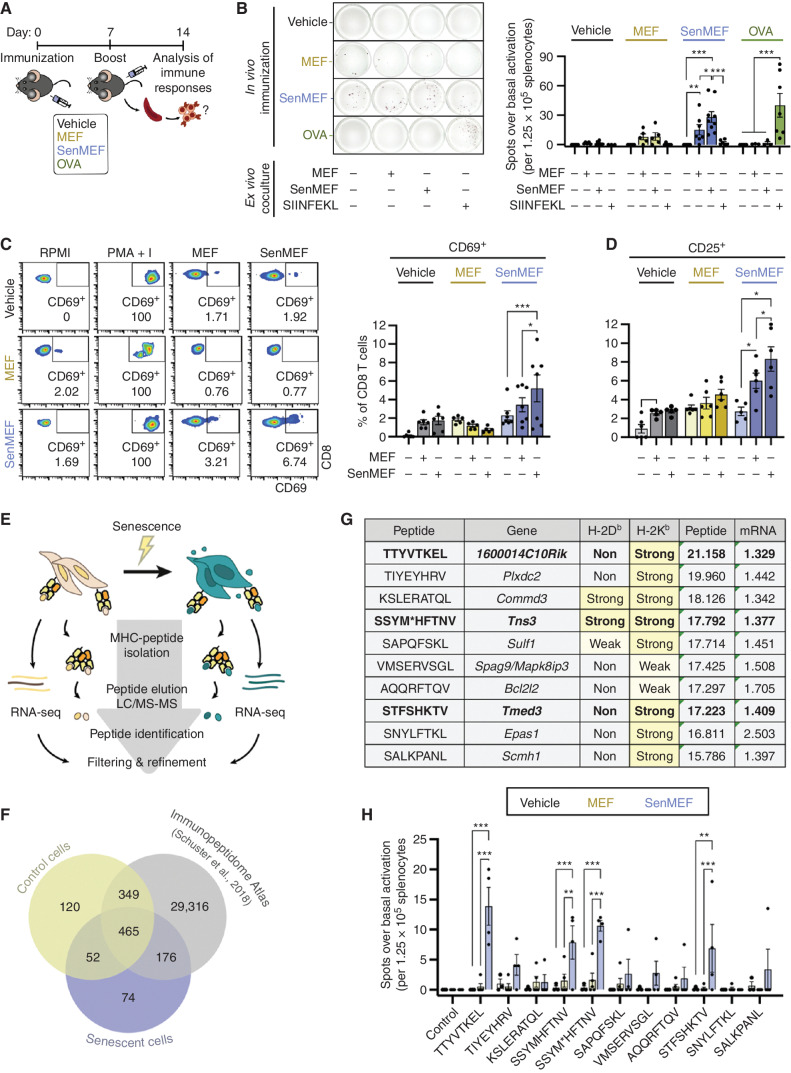
Figure 2.
Senescent noncancer cells induce an adaptive immune response in vivo and present unique immunogenic peptides. A, Schematic outline of the immunization protocol used in this study. Briefly, immunocompetent C57BL/6 animals were subcutaneously immunized on days 0 and 7 with vehicle (no cells), control or senescent syngeneic fibroblasts (MEF or senMEF, respectively), or OVA, all done concomitantly with an immune adjuvant (CpG). One week later, animals were sacrificed, and immune responses were tested ex vivo.B, ELISpot assay to detect IFNγ production in splenocytes isolated from nonimmunized mice (vehicle) or animals immunized with control MEF, senMEF, or OVA (n = 3–7 mice per group). Splenocytes were cultured in RPMI either alone (control) or cocultured with control MEF (1:10 target-to-splenocyte ratio), senMEF (1:10 target-to-splenocyte ratio), or SIINFEKL OVA-derived peptide (400 nmol/L). The number of spots for each condition above the control condition (background) was quantified. Representative pictures (left) and quantification (right) are shown. ***, P < 0.001; **, P < 0.01; *, P < 0.05; two-way ANOVA test. C, Flow cytometry analysis of CD69 activation marker in CD8 T cells from naïve (vehicle) versus MEF- or senMEF-immunized animals after culture in RPMI medium either alone or with PMA + I, MEF, or senMEF ex vivo. Representative pseudocolor plots and quantification of n = 5–7 mice per group are shown. ***, P < 0.001; *, P < 0.05; two-way ANOVA test. D, Flow cytometry analysis of CD25 activation marker in CD8 T cells from naïve (vehicle) versus MEF- or senMEF-immunized animals after culture in RPMI medium either alone or with PMA + I, MEF, or senMEF ex vivo (n = 5–7 mice per group). *, P < 0.05; two-way ANOVA test. E, Layout of combined immunopeptidomics and RNA-seq analyses in control versus senescent MEFs. F, Venn diagram displaying peptides identified in control cells, senescent cells, and the Mouse Immunopeptidome Atlas dataset (40). G, List of selected peptides presented exclusively on senescent cell MHC-I together with their corresponding coding gene and their predicted binding affinity to H-2Kb and H-2Db (NetMHCpan v4.1; classified as non-, weak, or strong binders, with the latter two highlighted in yellow). “Peptide” indicates the normalized log2(area) of the signal obtained in the immunopeptidomic mass spectrometry analysis for each peptide. Similarly, “mRNA” indicates the linear fold-change expression of the corresponding gene (senescent vs. control MEF) from the RNA-seq transcriptomic analysis are indicated. M* indicates M(+15.99), oxidized methionine. Bold font indicates those peptides that were validated as immunogenic (see next panel). H, Selected peptides validated using ELISpot assay to detect IFNγ production in splenocytes isolated from nonimmunized mice (vehicle) or animals immunized with MEF or senMEF (n = 3–5 mice per group). Splenocytes were cultured in RPMI medium either alone as negative control (control) or supplemented with the different peptides selected from the immunopeptidome analysis, as indicated. For SSYM*HFTNV peptide, both SSYMHFTNV and the modified SSYM*HFTNV were tested. The number of spots for each condition above the control condition (background) was quantified. ***, P < 0.001; **, P < 0.01; two-way ANOVA test.

