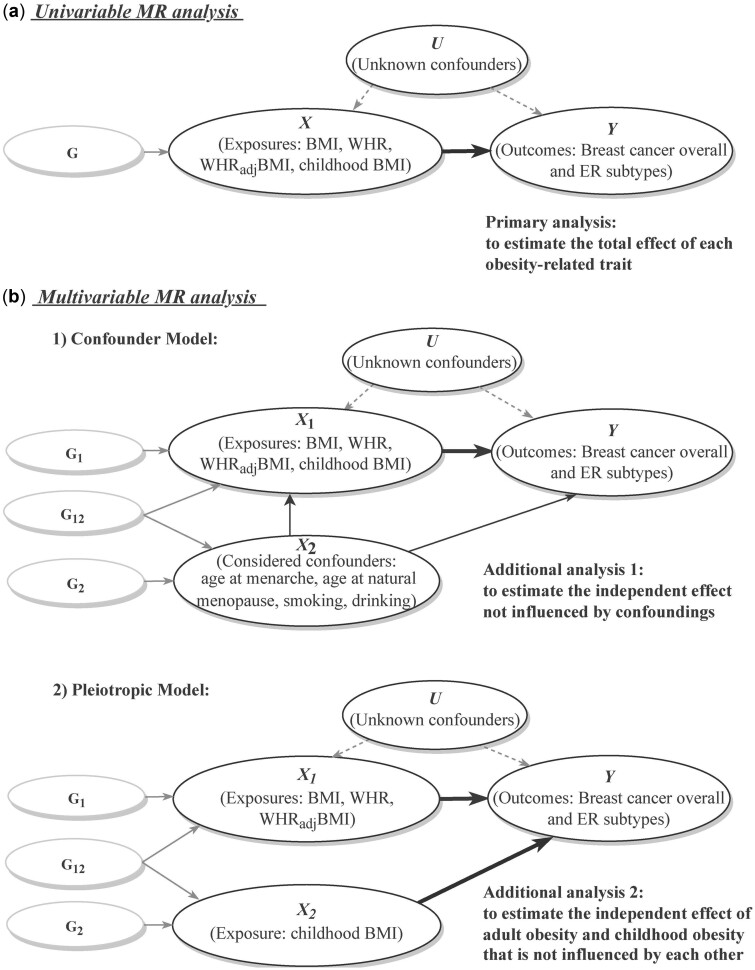
Figure 1.
Analytical schematic diagram of the Mendelian randomization (MR) analysis implemented in this study
(a) Univariable MR analysis; (b) multivariable MR analysis, including two models: (i) confounder model; (ii) pleiotropic model.
G represents genetic variants (single-nucleotide polymorphisms, SNPs) that reliably predict the exposure variable (X) and are used as instrumental variables to represent exposure. G1 and G2 represent SNPs that specifically affect X1 and X2, respectively, whereas G12 represents SNPs that affect both X1 and X2 simultaneously. Thick lines illustrate the causal effect confirmed by the current analysis.
BMI, body mass index; WHR, waist-to-hip ratio; WHRadjBMI, waist-to-hip ratio adjusted for body mass index; ER, oestrogen receptor.

