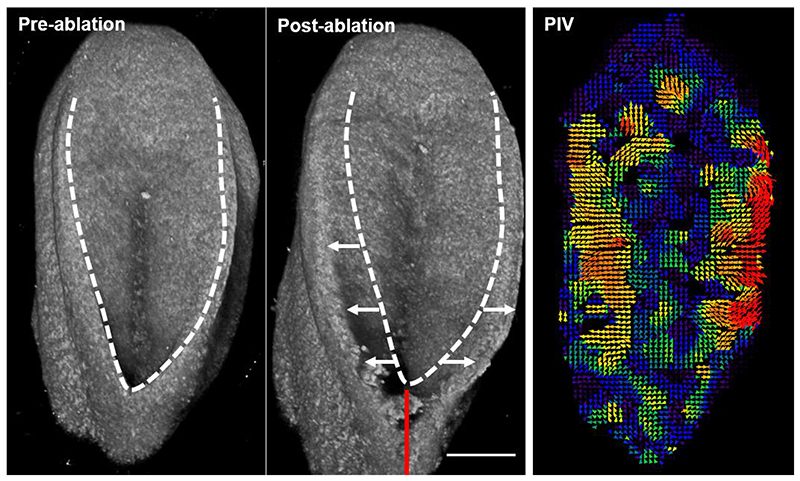
Figure 3. 3D projections of representative tissue-level ablation rostral to the mouse PNP fusion point.
The caudal end of the embryo is at the top of the image. The dashed line indicates the outline of the PNP before ablation, white arrows indicate PNP widening due to lateral tissue recoil and the red line indicates the ablated region. Recoil magnitude varies between genotypes and developmental stages (20). PIV analysis enables visualisation of PNP deformation several hundred microns caudal to the ablation site as previously reported (4). Scale bar = 100 μm.

