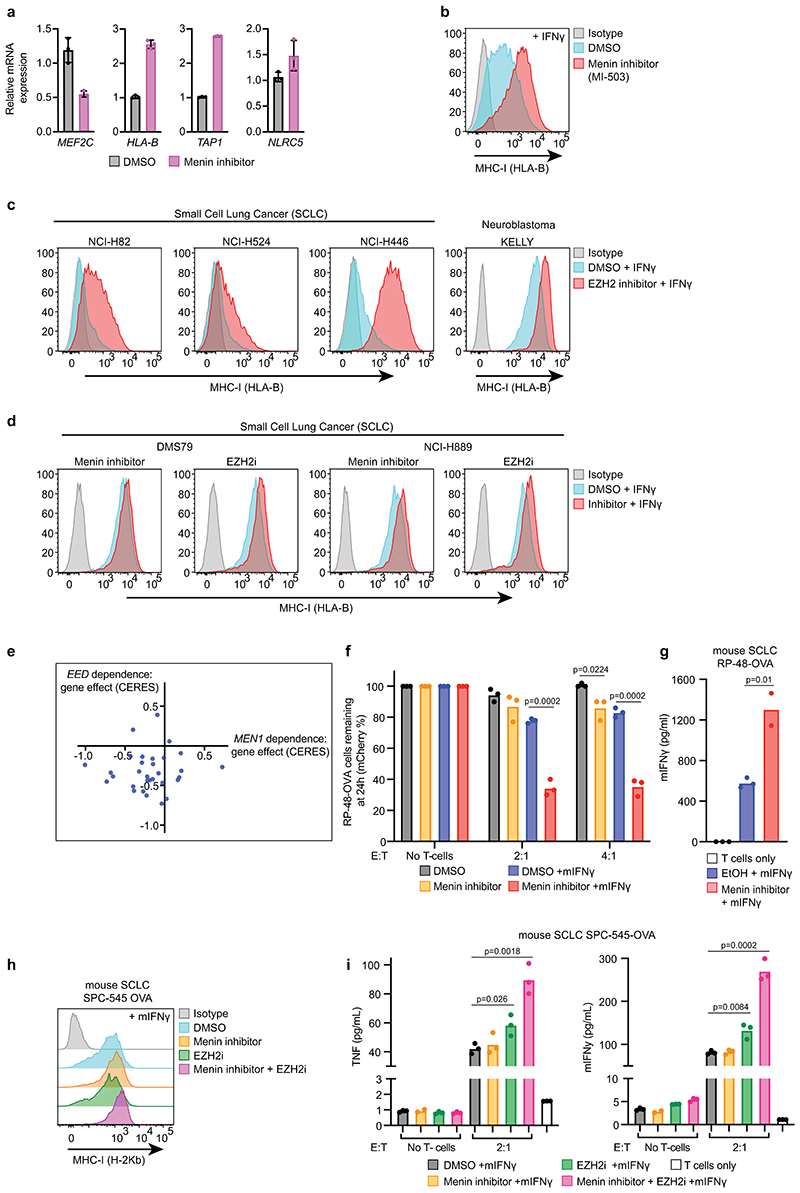
Extended Data Fig. 5. Pharmacological targeting of Menin-KMT2A/B and PRC2 similarly augment IFN-γ induced MHC-I expression in MHC-I low cancers and enhance T cell mediated killing.
(a) qRT-PCR analysis in K-562 cells treated ± 500nM VTP50469. Bars indicate mean ± s.d. of technical triplicates. (b) MI-503, a chemically distinct inhibitor of the Menin-KMT2A/B interaction, also enhanced IFN-γ induced MHC-I expression. Cell surface MHC-I in K562 Cas9 cells pre-treated with 500nM MI-503 and 10ng/mL IFN-γ (48h). Representative plot from 3 experiments (Supplementary Figure 3). (c) Cell surface MHC-I in cells treated with DMSO or 3μM EPZ-011989 and 10ng/mL IFN-γ (24h SCLC, 40h KELLY), (VTP50469 treatment: Figure 4a). Representative plots from independent experiments (n=2 SCLC, n=3 KELLY (Supplementary Figure 3)). (d) Cell surface MHC-I expression in SCLC cells treated with DMSO, 1μM VTP50469 or 3μM EPZ-011989 and 10ng/mL IFN-γ for 24h. Representative plots from 2 experiments (Supplementary Figure 3). (e) Scatter plot indicating MEN1 and EED CERES gene perturbation effects for neuroblastoma cell lines evaluated in combined CRISPR screens in DepMap (DepMap 21Q2 Public+Score, CERES (httos://denman.org/nortal/)31, 32 (f) Flow cytometry analysis of RP-48-OVA cells pre-treated with DMSO or 1μM VTP50469 and 10ng/mL murine IFN-γ (24h) prior to co-culture with OVA antigen-specific OT-I T cells at the indicated effector:target (E:T) ratios. Bars indicate mean percent remaining mCherry positive (RP-48-OVA) cells compared to no T-cell control from 3 independent replicates, indicated by points. Unpaired two-tailed t-tests compared to respective DMSO controls. Significant changes are indicated. (g) Cytometric Beads Array (CBA) assay for mIFN-γ following 24h co-culture of RP-48-OVA cells pre-treated with DMSO or 1μM VTP50469 and 10ng/mL murine IFN-γ (24h) prior to co-culture with OVA antigen-specific OT-I T cells at a 2:1 (E:T) ratio. Bars show mean expression from 2-3 independent replicates, indicated by points. Unpaired two-tailed t-test, p=0.01. (h) Cell surface MHC-I in SPC-545-OVA cells pre-treated with DMSO, 1μM VTP50469 and/or 3μM EPZ-011989, and 1ng/mL murine IFN-γ (24h). Representative plot from 2 experiments (Supplementary Figure 3). (i) CBA assay for mIFN-γ and TNF following 4 days co-culture of pre-treated SPC-545-OVA cells (DMSO, 1μM VTP50469 and/or 3μM EPZ-011989 and 2h 20ng/mL mIFN-γ) with OVA antigen-specific OT-I T cells at a 2:1 (E:T) ratio. Bars show mean expression from 3 independent replicates, indicated by points. Unpaired two-tailed t-test compared to respective DMSO +mIFN-γ controls. Significant changes are indicated.

