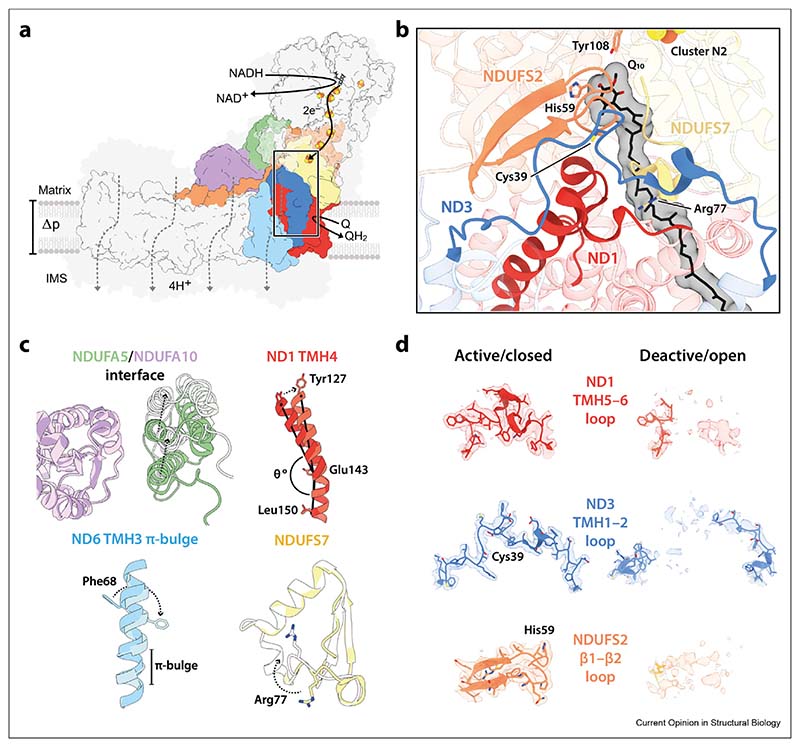
Figure 1. Architecture of complex I and key elements of the active/closed–deactive/open transition.
a) A schematic overview of mammalian complex I. Key subunits involved in the active/closed–deactive/open transition are shown in colour, with the remaining core and supernumerary subunits outlined in black or shaded in grey, respectively. The ubiquinone-binding channel is indicated with a box and four proton transfer routes are shown schematically with dotted lines. b) A cartoon representation of the ubiquinone-binding channel in the active/closed state [PDB: 7QSL (protein), 7QSK (Q10)], outlining ND1-TMH4 and the ND1-TMH5–6, ND3-TMH1–2, NDUFS2-β1–β2, and NDUFS7-Arg77 loops. c–d) Key elements of the active/closed–deactive/open transition. Models for the deactive/open state [PDB: 7QSN] are shown in lighter shades. CryoEM densities [EMD-14133 (active/closed); EMD-14140 (deactive/open)] in d are shown at a map threshold of 5 in UCSF ChimeraX. Relevant residues are annotated, and subunits coloured throughout as follows: ND1, red; ND3, blue; ND6, light blue; NDUFS2, orange; NDUFS7, yellow; NDUFA5, green; NDUFA10, purple. Abbreviations: Q/QH2, ubiquinone/ubiquinol; Q10, ubiquinone-10; Δp, proton-motive force; IMS, intermembrane space; TMH, transmembrane helix.

