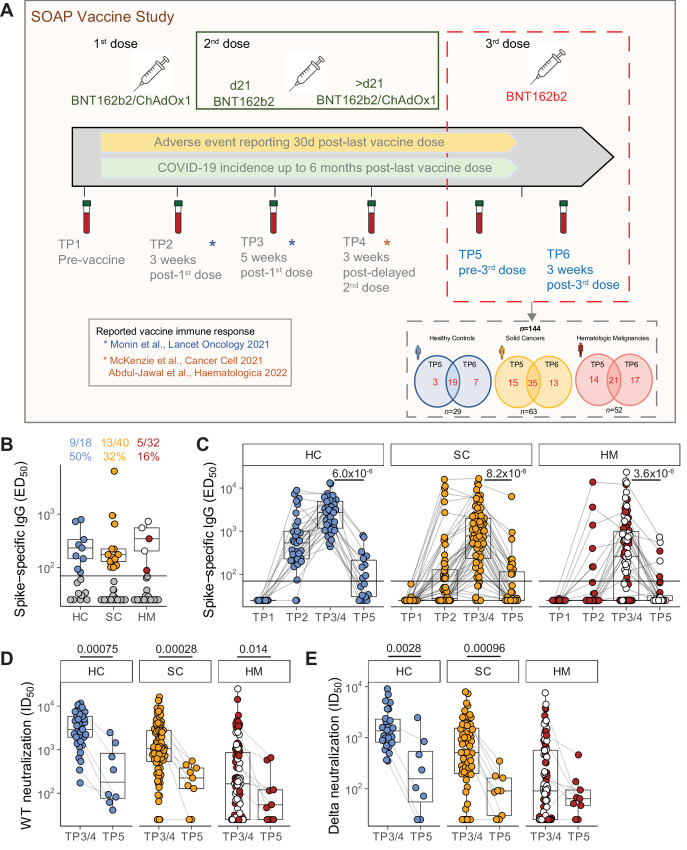
FIGURE 1.
Waning serologic responses to SARS-CoV-2 vaccination. A, Study design. Venn diagrams demonstrated the number of patients recruited for TP5 and TP6 analysis, as well as patients with both timepoints available for analysis. B, Plasma spike-specific IgG titres at TP5. Numbers represent the frequency of individuals with titres above the seropositivity threshold (>70 EC50 dilution). Sample comparisons tested by a Kruskal–Wallis test with Dunn multiple comparisons test and corrected by the Holm method (ns). Boxplots and statistics summarize responder values only (HC n = 9/18, SC n = 13/40, HM n = 5/32). Gray: nonresponders; blue: HC, orange: SC, red: non-MDS HM, white: MDS HM. C, Spike-specific IgG titres in plasma samples at TP1–5. Patient-matched samples are linked by lines. Matched samples at TP3/4 and TP5 (HC n = 15, SC n = 37, HM n = 31) were compared by a Wilcoxon signed-rank test and P values corrected by the Benjamini–Hochberg method. White: MDS. Plasma neutralization titres against wildtype (D) and B.1.617.2 delta (E) SARS-CoV-2 variants at TP3/4 and TP5. Sample comparisons tested by a partially matched Wilcoxon test and P values corrected by the Benjamini–Hochberg method (WT TP3/4: HC n = 37, SC n = 83, HM n = 93; delta TP3/4 n = 26, SC n = 64, HM n = 88; WT/delta TP5 n = 8, SC n = 9, HM n = 9). White: MDS. Boxplots represent the median, Q1 and Q3. Horizontal lines represent response thresholds. ED50: plasma dilution at 50% binding; HC: healthy control; HM: hematologic malignancy; ID50: inhibitory dilution at which 50% of virus particles are neutralized; MDS: myelodysplastic syndrome; ns: nonsignificant; SC: solid cancer; TP: timepoint.

