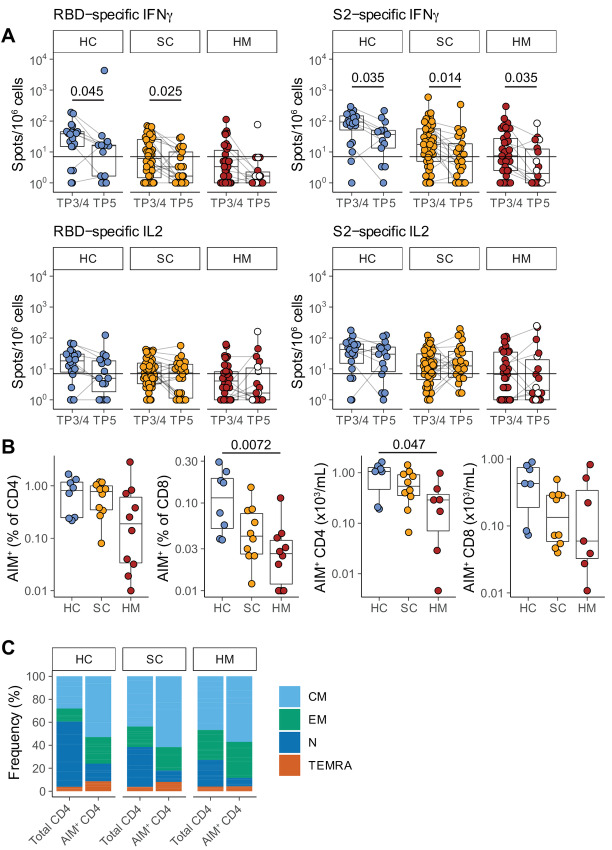
FIGURE 2.
T-cell responses prior to SARS-CoV-2 vaccination dose 3. A, Functional T-cell responses were measured using fluorospot assays to measure IFNγ and IL2 release by T cells stimulated with one of the following peptide mixes presented on autologous antigen-presenting cells: SARS-CoV-2 spike 2 peptides (“S2”); SARS-CoV-2 RBD peptides (“RBD”); and control peptides derived from CEFT at TP3/4 and TP5. Individuals were classified as responders if they scored >7 cytokine secreting cells/106 PBMC for IFNγ and/or for IL2 in response to RBD and/or S2 peptide pools. Sample comparisons tested by a partially matched Wilcoxon test and P values corrected by the Benjamini–Hochberg method (TP3/4: HC n = 20, SC n = 48, HM n = 37; TP5 HC n = 14, SC n = 26, HM n = 18; n is variable due to technical dropouts). White: MDS. B, Frequency (left) and number (right) of spike-specific AIM+ CD4 and CD8 T cells at TP5, as defined by AIM+ cell frequency following stimulation with spike peptide pools minus control stimulation. Sample comparisons tested by a Kruskal–Wallis test with Dunn multiple comparisons test and corrected by the Holm method (HC n = 8, SC n = 10, HM n = 10; n is variable due to cell count dropouts). C, Frequency of naïve and memory subsets among total and AIM+ CD4 T cells following restimulation with spike peptide pools. Boxplots represent the median, Q1 and Q3. Horizontal lines represent response thresholds. AIM: activation-induced markers; HC: healthy control; HM: hematologic malignancy; MDS: myelodysplastic syndrome; ns: nonsignificant; SC: solid cancer; TP: timepoint.

