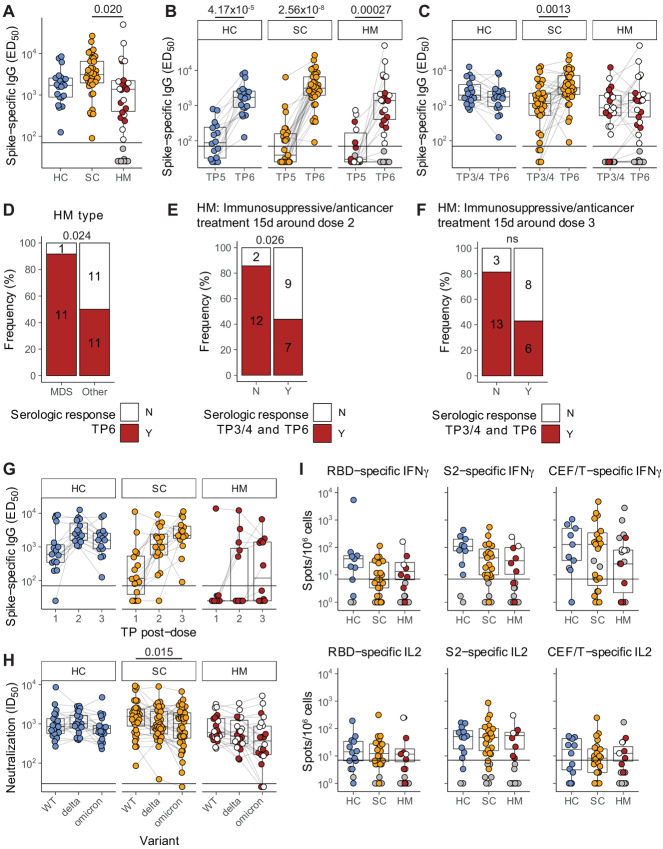
FIGURE 3.
Boosted serologic responses and persistent T-cell responses following SARS-CoV-2 vaccination dose 3. A, Plasma spike-specific IgG titres at TP6. Numbers represent the frequency of individuals with titres above the seropositivity threshold. Sample comparisons tested by a Kruskal–Wallis test with Dunn multiple comparisons test and corrected by the Holm method. Boxplots and statistics summarize responder values only (HC n = 21/21, SC n = 37/37, HM n = 22/34). Gray: nonresponders; white: MDS. Spike-specific IgG titres in plasma samples at TP5 to TP6 (B) and TP3/4 to TP6 (C). Patient-matched samples are linked by lines. Matched samples at both TP were compared by a Wilcoxon signed-rank test and P values corrected by the Benjamini–Hochberg method. Boxplots and statistics summarize only patients who were serologic responders at both TP in (HC n = 15/15, SC n = 27/27, HM n = 10/18; B) and (HC n = 18/18, SC n = 35/35, HM n = 21/32; C). Gray: serologic nonresponders at both TP; white: MDS. D, Serologic response at TP6 comparing MDS and other patients with HM. Contingency analysis performed by a Fisher exact test (MDS n = 12, other n = 22); numbers on graph indicate patient counts. Serologic responses at TP6 comparing overall serologic response of patients with HM with matched TP3/4 and TP6 samples receiving immunosuppressive and/or antitumor treatment within 15 days either side of dose 2 (E) or dose 3 (F). Contingency analysis performed by a Fisher exact test in (untreated n = 14, treated n = 16; E) and (untreated n = 16, treated n = 14; F); numbers on graphs indicate patient counts. G, Longitudinal analysis of spike-specific IgG titres after each dose (TP2, TP3/4, and TP6) in patients with matched datasets (HC n = 15, SC n = 16, HM n = 12). H, Plasma neutralization titres against wildtype, B.1.617.2 (delta) and BA.1 (omicron) SARS-CoV-2 variants in serologic responders at TP6 (matched patient samples are linked). Sample comparisons tested by a Friedman test with Wilcoxon signed-rank post-tests and P values corrected by the Bonferroni method (HC n = 21, SC n = 36, HM n = 22). White: MDS. I, T-cell IFNγ and IL2 responses to SARS-CoV-2 RBD and S2 peptide pools at TP6. Only patients who were overall T-cell responders are represented by boxplots and compared by a Kruskal–Wallis test with Dunn multiple comparisons test and corrected by the Holm method (HC n = 12/14, SC n = 20/26, HM n = 8/19), all ns. Gray: T-cell nonresponders; white: MDS. Boxplots represent the median, Q1 and Q3. Horizontal lines represent response thresholds. ED50: plasma dilution at 50% binding; HC: healthy control; HM: hematologic malignancy; MDS: myelodysplastic syndrome; ns: nonsignificant; SC: solid cancer; TP: timepoint.

