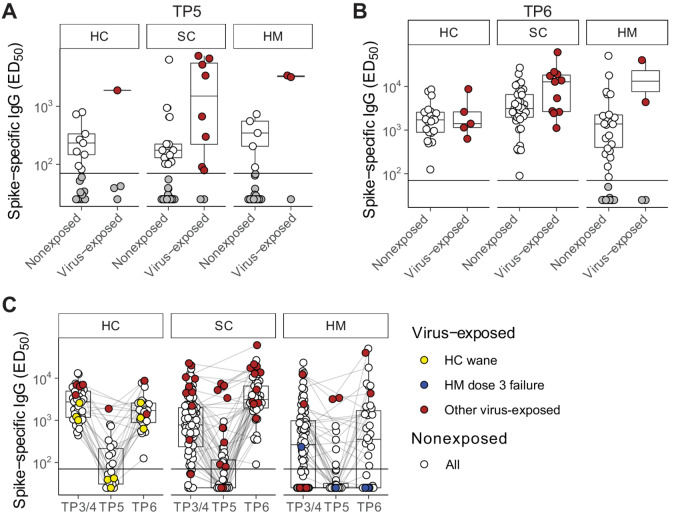
FIGURE 4.
Serologic wane and boost around SARS-CoV-2 vaccine dose 3 in naturally exposed individuals. Plasma spike-specific IgG titres in unexposed and previously SARS-CoV-2 exposed patients at TP5 (A) and TP6 (B). Numbers represent the frequency of individuals with titres above the seropositivity threshold. Sample comparisons tested by Wilcoxon rank-sum test and P values corrected by the Benjamini–Hochberg method, all ns. Boxplots and statistics summarize responder values only in (HC unexposed n = 9/18, exposed n = 1/4; SC unexposed n = 13/40, exposed n = 8/10; HM unexposed n = 5/32, exposed n = 2/3; A) and (HC unexposed n = 21/21, exposed n = 5/5; SC unexposed n = 37/37, exposed n = 11/11; HM unexposed n = 22/34, exposed n = 2/4; B). C, Longitudinal analysis of spike-specific IgG titres in all patients at TP3/4, TP5, and TP6 (HC unexposed n = 41, exposed n = 8; SC unexposed n = 86, exposed n = 18; HM unexposed n = 95, exposed n = 8 unique patients). Matched patient samples are linked. White: unexposed; red: naturally exposed; yellow: examples of naturally exposed HC (n = 3) who exhibited a wane/boost effect; blue: examples of naturally exposed HM (n = 2) who failed to respond to dose 3. Boxplots represent the median, Q1 and Q3. Horizontal lines represent response thresholds. ED50: plasma dilution at 50% binding; HC: healthy control; HM: hamatologic malignancy; MDS: myelodysplastic syndrome; ns: nonsignificant; SC: solid cancer; TP: timepoint.

