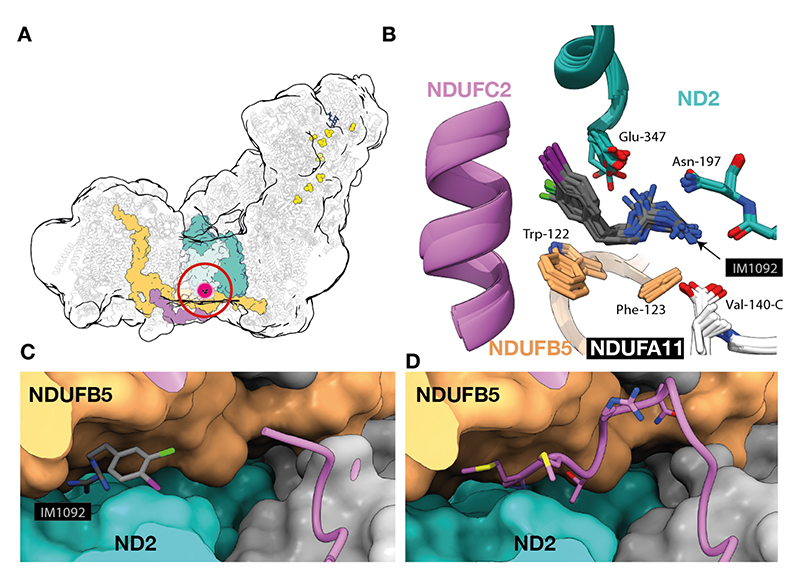
Fig. 4. Location of the biguanide binding at the ND2/NDUFB5/NDUFA11 interface.
A) Overall location of the binding site. Purple, NDUFC2; teal, ND2; orange, NDUFB5. B) An overlay of all models aligned to ND2. C) Surface representation (Active-1092-ii model) showing subunit NDUFC2 in cartoon with atoms shown for IM1092. D) The same view from the active inhibitor-free model showing the atoms from residues 1-7 of NDUFC2. Local interactions and density for the individual maps and models are shown in Figs. S26-27.

