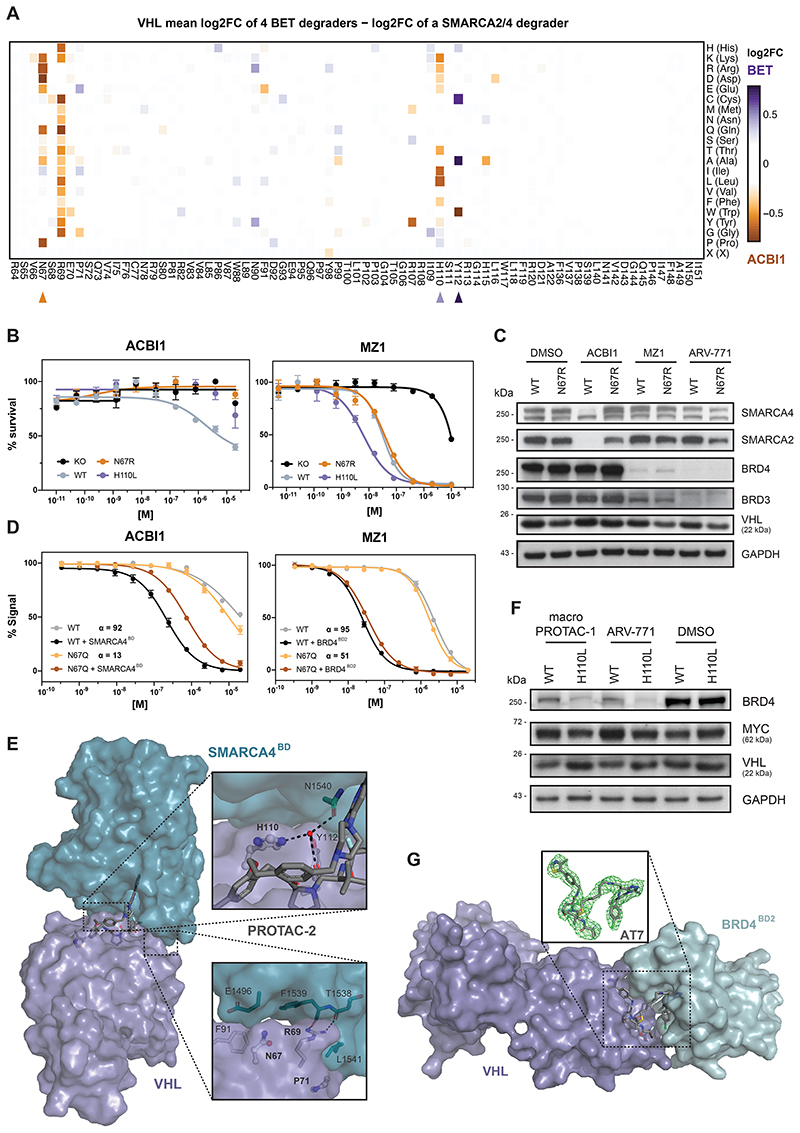
Figure 3. Functional VHL Hotspots Identified by DMS Show Neo-Substrate Dependent Resistance and Sensitivity to PROTAC Treatment.
(A) Heatmap depicting differential log2 fold-enrichment of VHL mutations normalized to maximum log2 fold-changes vs. DMSO between the mean of 4 BET PROTACs (500 nM ARV-771, 500 nM MZ1, 500 nM AT7, 2 μM macroPROTAC-1) and the SMARCA2/4 PROTAC ACBI1 (2 μM). Treated for 7 days; n = 2 independent measurements.
(B) Dose-resolved, normalized viability after 4 d treatment (ACBI1, left) and 3 d treatment (MZ1, right) in RKO VHL-/- cells with over-expression of VHLWT, VHLN67R or VHLH110L. Mean ± s.e.m.; n = 3 independent treatments.
(C) Protein levels in RKO VHL-/- cells with over-expression of VHLWT or VHLN67R treated with DMSO, ACBI1 (2.5 μM, 4h), MZ1 (75 nM, 2h) and ARV-771 (50 nM, 2h). Representative images of n = 2 independent measurements.
(D) Fitted curves from fluorescence polarization competition assays measuring displacement of a VHL peptide from either WT or mutant VCB protein by ACBI1 (left) or MZ1 (right) in the presence or absence of saturating concentrations of SMARCA4BD or BRD4BD2 protein. Mean ± s.d.; n = 3 technical replicates.
(E) Cocrystal structure of PROTAC-2 (close analogue to ACBI1) in a ternary complex with VHL-ElonginC-ElonginB and SMARCA4BD (PDB 6HAX).
(F) Protein levels in RKO VHL-/- cells with over-expression of VHLWT or VHLH110L treated with DMSO, macroPROTAC-1 (250 nM, 2h), ARV-771 (12.5 nM, 90 min). Representative images of n = 2 independent measurements.
(G) Cocrystal structure of AT7 in a ternary complex with VHL-ElonginC-ElonginB and BRD4BD2 solved to a resolution of 3.0 Å. The omit difference electron density map (Fo−Fc) is shown in green in the inset panel, superimposed around AT7 and contoured at 3σ. See also Extended Data Fig. 4.

