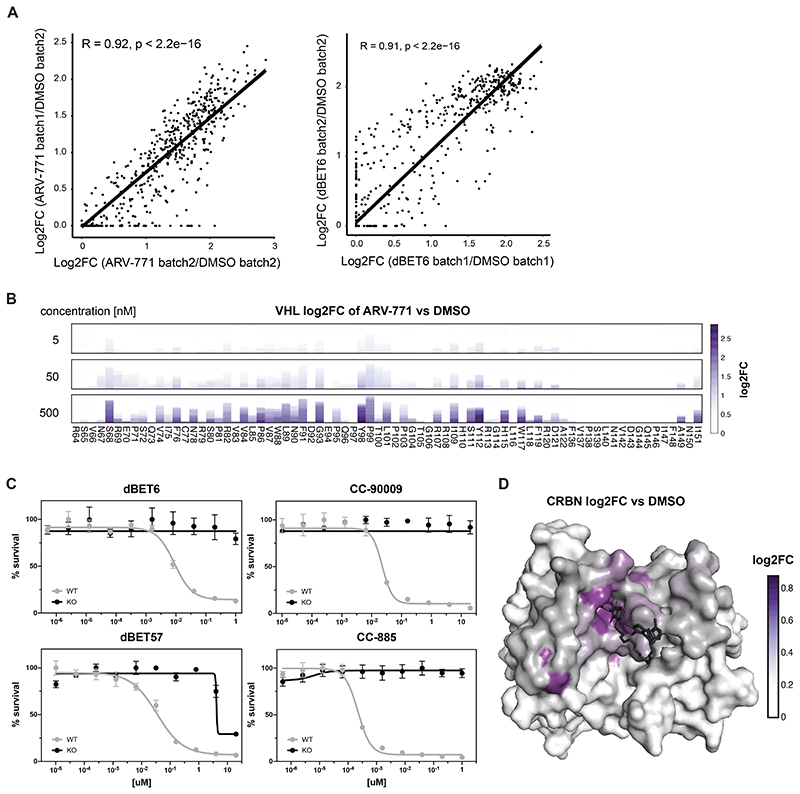
Extended Data Figure 3.
(A) Scatter plot depicting log2 fold-enrichment between different batch mutational scanning resistance measurements of VHL (500 nM ARV-771) or CRBN mutations (500 nM dBET6) normalized to DMSO after 7-day treatment. The rank-based measure of association was estimated via Spearman’s rho statistic and reported P-values were calculated via asymptotic two-sided t approximation without adjustments for multiple comparisons.
(B) Stacked bar graphs of log2 fold-enrichment of VHL mutants normalized to DMSO treated with the indicated concentrations of ARV-771 for 7 days. n = 2 independent measurements.
(C) Dose-resolved, normalized viability after 3 d treatment with dBET6, CC-90009, dBET57 or CC-885 in RKO CRBN-/- cells with over-expression of CRBNWT. Mean ± s.e.m.; n = 3 independent treatments.
(D) Surface structure of CRBN bound by dBET6 (PDB 6BOY). Median log2 fold-enrichment of all CRBN mutations over DMSO across 4 degrader treatments (see Figure 2D) is mapped in purple to dark grey onto positions mutated in the CRBN library.

