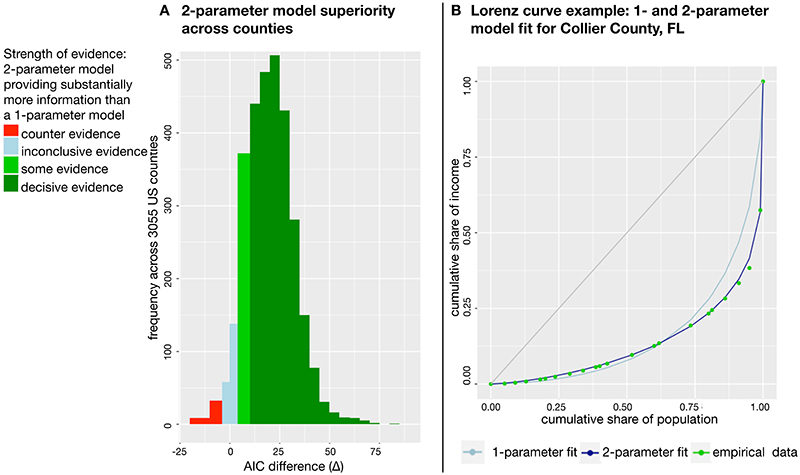
Fig. 2. The strength of evidence in favor of the two-parameter Ortega model.
A. The histogram plots the AICc differences (Δi,j) between the one-parameter lognormal model (i) and two-parameter Ortega (j). To categorize strength of evidence, we define the following ranges: Δi,j > 10 implies decisive evidence that model j is superior to model i; Δi,j ∈ [4,10] implies some evidence; Δi,j ∈ [–4,4) implies inconclusive evidence; and Δi,j < –4 implies counter-evidence (i.e., evidence in favor of model i over j). B. An example to illustrate the goodness-of-fit of one-parameter versus two-parameter models of Lorenz curve to empirical data. For the two-parameter model, we fitted the Ortega Lorenz curve model using the empirical data points and maximum likelihood estimation, plotted next to the empirically best-fitting one-parameter model (lognormal Lorenz curve model).

