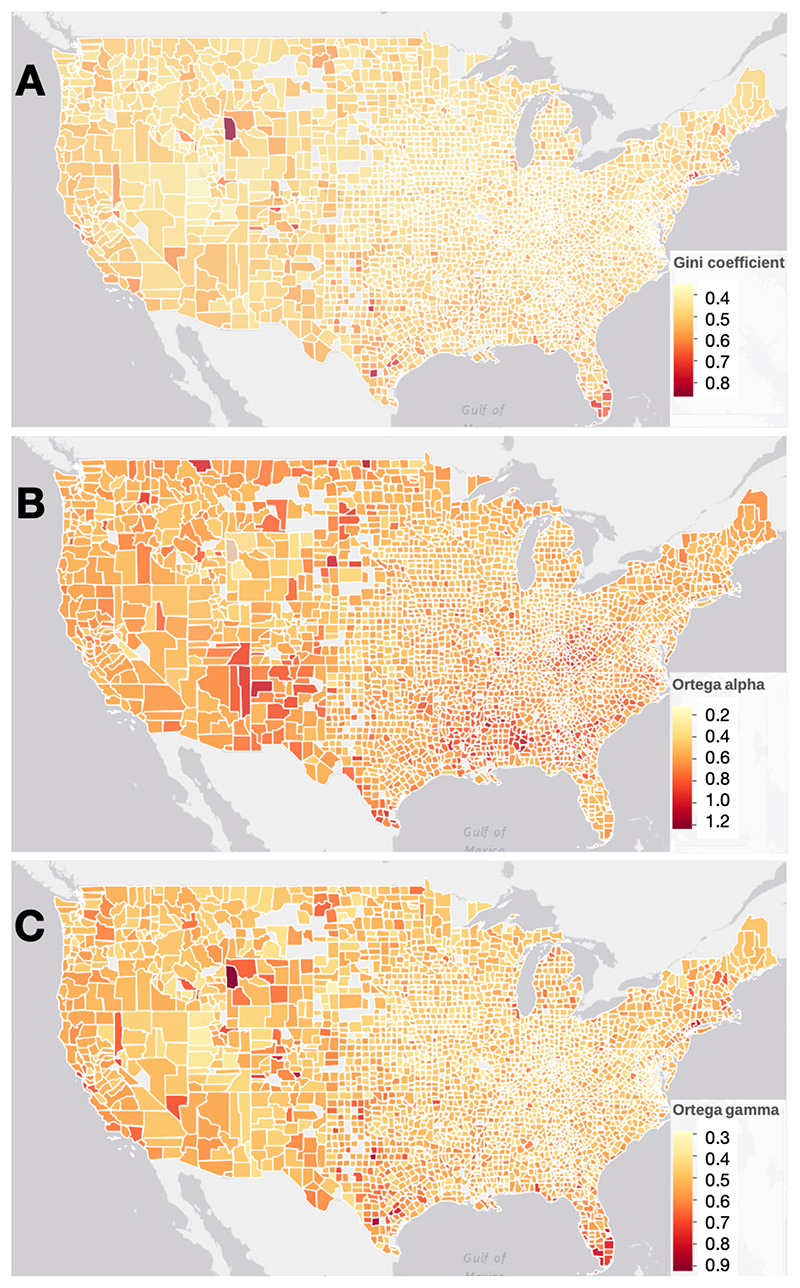
Fig. 4. Different representations of inequality across the United States.
We depict A the Gini coefficient, B the first Ortega parameter α (a measure of more bottom-concentrated inequality), and C the second Ortega parameter γ (a measure of more top-concentrated inequality). An interactive version of this figure is available at www.measuringinequality.com

