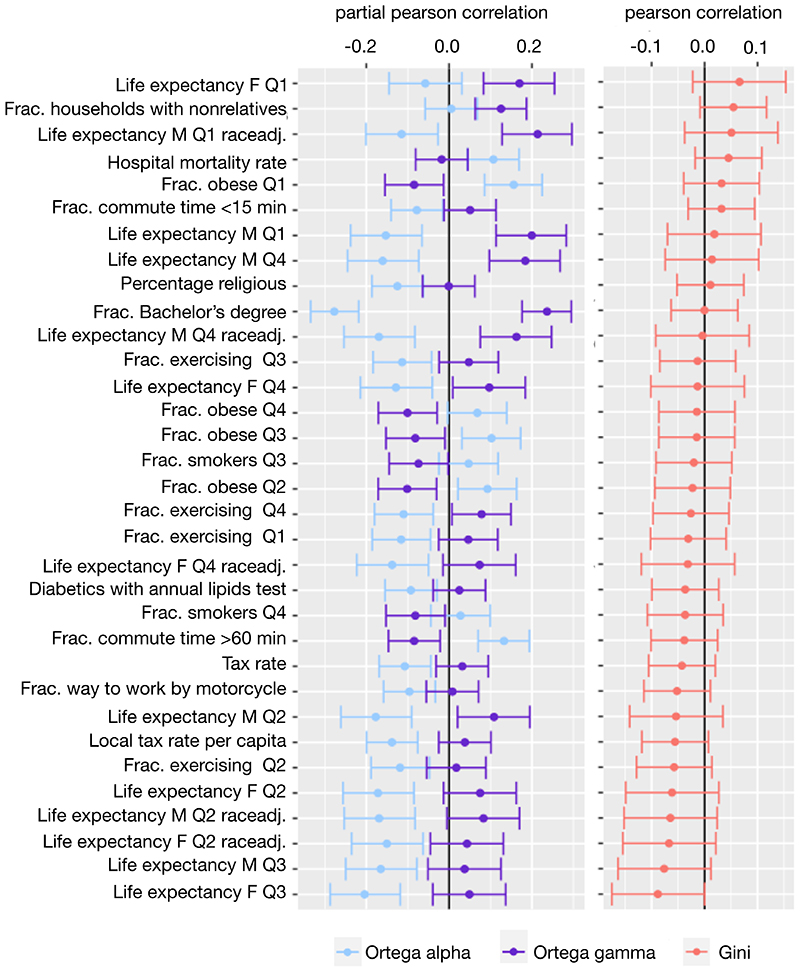
Fig. 5. A two-parameter Ortega approach reveals significant correlations between inequality and policy outcomes across N = 3 049 US counties that the Gini coefficient misses in our dataset.
Point estimates of the Pearson correlations (Gini coefficient) and partial Pearson correlations (Ortega parameters) with policy outcomes are visualized with confidence bounds of the 0.9995 confidence interval, using a Bonferroni correction. The figure shows the subsample of covariates (33 of 100) for which the Pearson correlations between county-level variables were not significantly related to the Gini coefficient but exhibited at least one statistically significant partial correlation with the Ortega parameters. Abbreviations: M - male; F - female; Q - income quartile; Frac. - fraction; raceadj. - race adjusted

