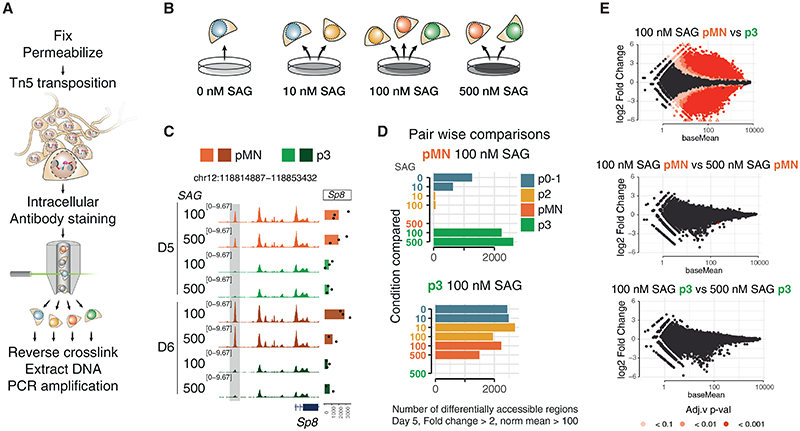
Figure 2. Chromatin accessibility reflects cell-type identity independent of SAG concentration.
(A) Schematic of CaTS-ATAC, a strategy for cell-type-specific ATAC-seq based on intracellular markers developed for this study.
(B) Cell types analyzed from each SAG concentration.
(C) Representative genome coverage plot of a differentially accessible region and expression of the nearby gene, Sp8, shows accessibility is consistent for each cell type regardless of the SAG concentration from which it was generated.
(D) Quantification of differentially accessible regions between the indicated sample and all other samples at day 5 of differentiation shows no significant differences with the same cell type generated from a different SAG concentration. Thresholds used: absolute fold change > 2, basemean > 100.
(E) MA-plot (log2-fold change versus base mean) for the indicated comparisons show large numbers of differentially accessible elements between different cell types generated under the same SAG concentration, but not between the same cell type generated in different SAG concentrations. n = 3 biological replicates. See also Figure S2.

