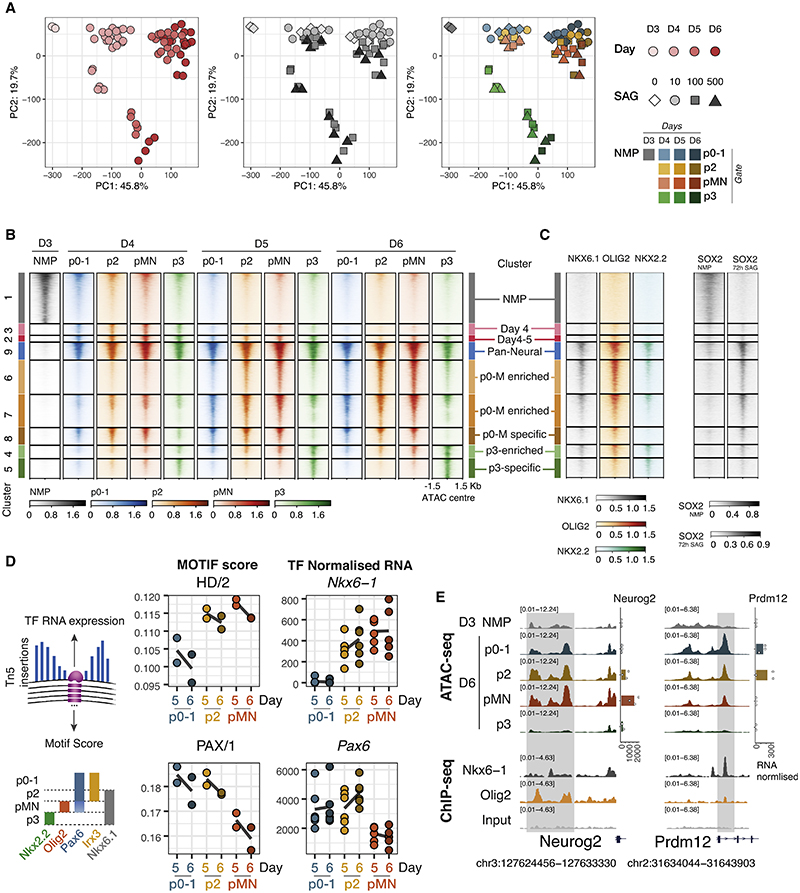
Figure 3. Two regulatory landscapes underlie the Shh response of neural progenitors.
(A) Dimensionality reduction (principal component analysis) based on the most variable 30,000 consensus elements shows two different behaviors: a shared one for p0-1, p2, pMN samples, and a different one for p3 samples, regardless of SAG concentration. Each symbol represents a sample colored by differentiation day, SAG concentration, or cell type as indicated in the legend. n = 3 biological replicates (independent differentiations).
(B) Heatmap showing ATAC-seq coverage for elements differentially accessible between any two cell types or time points with the same dynamics, grouped in clusters (see STAR Methods) shows decommissioning of the NMP program (cluster 1), a shared pan-neuronal cluster (cluster 4) and two behaviors in cell type-specific accessibility, a shared for p0-1, p2, and pMN samples (clusters 6–8), and a unique program for p3 (clusters 4 and 5). Elements ordered by average accessibility.
(C) Heatmap of ChIP-seq coverage for the same elements for NKX6.1, OLIG2, and NKX2.216 performed in neural embryoid bodies treated with SAG shows binding to both pan-neuronal and cell-type-specific elements, and SOX2 from either NMP stage32 or SAG-treated neural embryoid bodies13 correlates with accessibility in either NMP or neural progenitors, respectively.
(D) Footprinting scores (using TOBIAS, see STAR Methods) for motifs with highly variable scores between p0-1, p2, and pMN at days 5 and 6, and normalized RNA counts for the most correlated TF within the motif archetype. The motifs for cell-type-specific TFs show expected footprinting differences.
(E) Example loci that are accessible across p0-pMN but were not accessible at day 3 and do not became accessible in p3 NPs. ChIP-seq for NKX6.1 and OLIG216 shown for the same elements. Normalized expression for nearby genes Neurog2 and Prdm12 shown. Points are individual samples; bars represent average expression.
See also Figure S3.

