Figure 7.
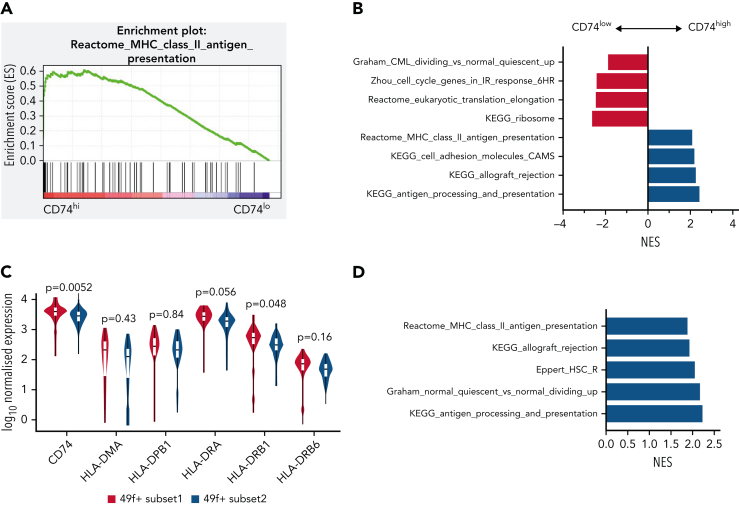
MHCII high expression marks a subset of HSCs in a deeper quiescent state in human. (A) Enrichment plot of Reactome: MHC Class II Antigen Presentation from GSEA analysis of human CB LT-HSCs comparing the top 30% of CD74 expression (CD74hi) and bottom 30% of CD74 expression (CD74lo). (B) Selected biological pathways (c2 curated pathways; FDR < 0.05) from preranked GSEA of human CB LT-HSCs with top 30% CD74 expression (CD74hi) compared with bottom 30% CD74 expression (CD74lo) (50 cells) from Belluschi et al.55 (C) Normalized expression of key MHCII regulators; FDR for differential expression between 49f+ Subset1 and 49f+ Subset2 as determined by DESeq2 shown. (D) Selected biological pathways (c2 curated pathways; FDR < 0.05) enriched in preranked GSEA analysis of 49f+Subset1 (CD34lo/C9Ahi) and 49f+Subset2 (CD34hi/C9Alo) from Belluschi et al.55 FDR, false discovery rate; NES, normalized enrichment score.

