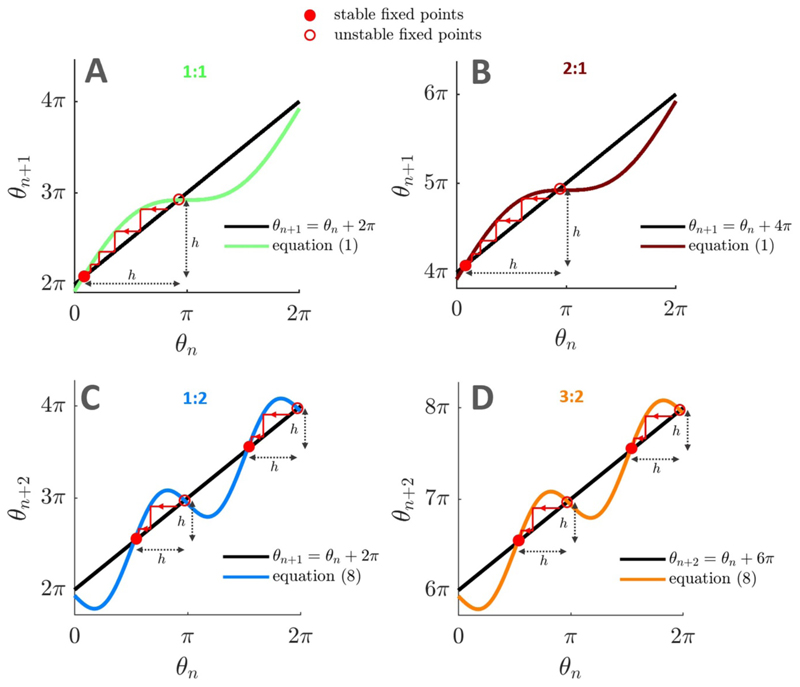
Figure 7.
Cobweb plots of the deterministic sine circle map for different frequency locking ratios. Cobweb plots used to study frequency-locking in the deterministic sine circle map reveal the size of the trap (denoted by h, shortest distance between a stable and an unstable fixed point) that can prevent dithered stimulation from breaking frequency locking. Stable fixed points are identified by filled red circles, unstable fixed points by empty red circles. Parameters used are f0 = 125 Hz, I = 1 (A), f0 = 255 Hz, I=1(B),f0 = 63 Hz, I = 1.5 (C), f0 = 193 Hz, I = 1.5 (D). In all panels, fs =130 Hz.

