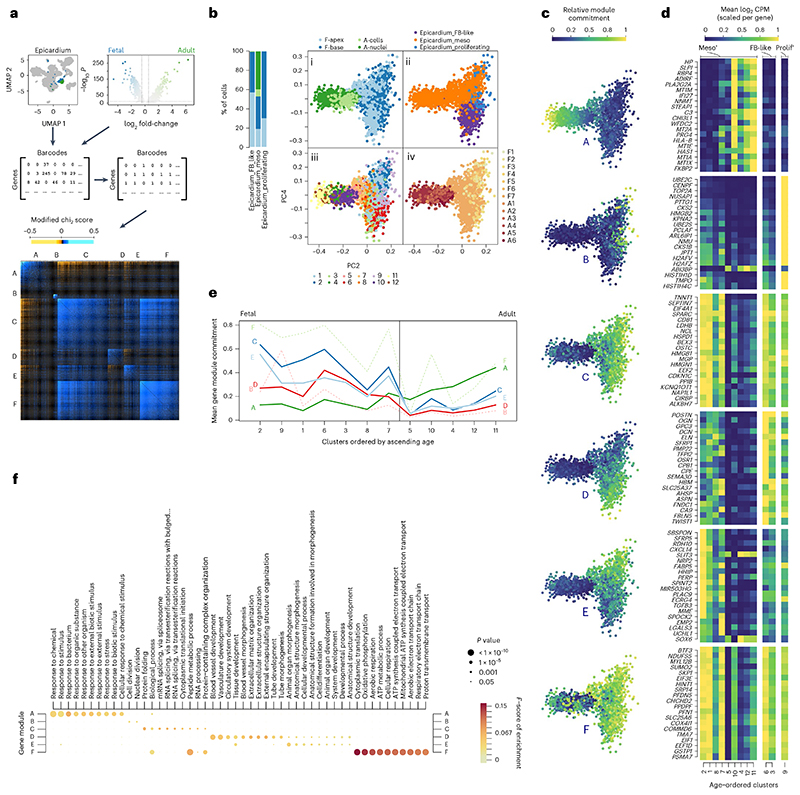
Fig. 3. Different human epicardial states are determined by gene modules.
a, Gene modules of the human epicardium were identified through adult versus fetal differential expression analysis and co-occurrence clustering. b, Epicardial cell states were identified using PCA, illustrating the cell sources (bi); previous clustering of the heart cells at resolution 2 (bii); clustering across gene module commitment (biii); and ranked age of samples (biv). Further PCA plots in c show the commitment of epicardial cells toward each gene module, and age-ordering of epicardial cells shows the age-associated changes in gene expression in the top 20 gene from each module (d) and the age-associated changes in commitment toward each module across epicardial clusters (e). f, Dot plot depicts Gene Ontology biological process term enrichment for each module, showing scores of significance and harmonic mean of recall and precision. Gene set significance was calculated using hypergeometric tests (background genes, n = 27,956) and adjusted for multiple comparisons using gprofiler’s g:SCS algorithm.

