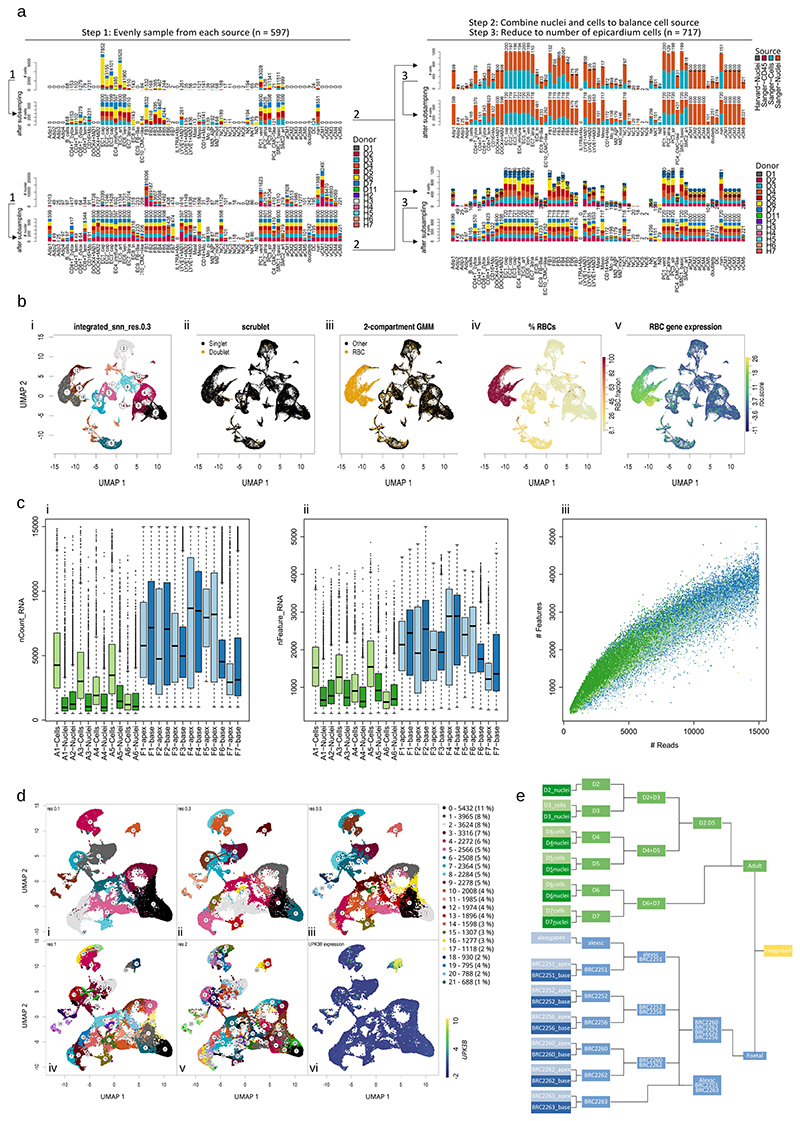
Extended Data Fig. 1. Stratified sampling, integration, and quality of adult and fetal scRNA-seq datasets.
Processing of adult and fetal datasets and integration with a, subsampling stratifications and step-wise subsampling strategy for adult cells and nuclei; b, naive integration of fetal data and uniform manifold approximation and projection (UMAP) showing i, clustering; ii, predicted doublets; iii, erythrocyte detection using a two-compartment Gaussian mixture model on the summed expression of erythrocyte genes HBB, HBG1, HBG2, HBM, HBA2, HBA1, HBQ1, ALAS2 allowing to identify; iv, high erythrocyte fraction clusters for removal; validated by v, the summed expression of erythrocyte genes. c, Fetal samples contained a greater quantity of i, UMIs and; ii, unique genes expressed and were downsampled to 15 000 UMIs and; iii, the resulting relationship between depth and complexity was similar in both adult and fetal samples. Fetal datasets were integrated after erythrocyte removal as shown and clustered ready for subsampling and integration as shown in d, i-v, Louvain clustering using resolutions of 0.1–2 respectively. Resolution 0.5 was selected with 21 clusters, which when subsampled down to the number of epicardial cells identified using epicardial markers such as vi, UPK3B (n = 1598), produced approximately the same number of fetal cells as subsampled adult cells. Integration of subsampled adult and fetal data; e, was performed hierarchically by prioritising donors in a custom integration tree. Distributions for each box in 1c(i-ii) were drawn from n = 1562, 3504, 5074, 1479, 3454, 1866, 2845, 2124, 3400, 959, 3763, 4226, 2072, 1709, 1941, 1919, 8023, 724, 3630, 1832, 576, 8597, 5460, and 6764 cells respectively in the order of plotted groups. Each distribution’s centre horizontal line denotes population median, while box edges and whiskers are drawn at 1 and 1.5 × interquartile range respectively.

