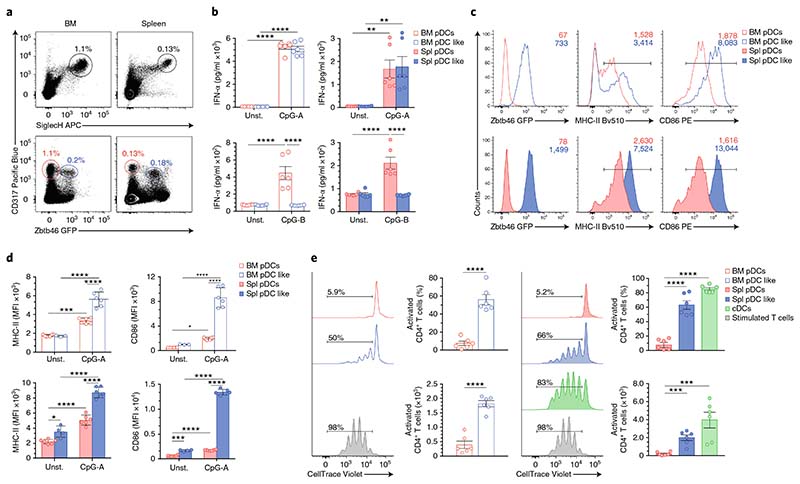
Fig. 8. Functional heterogeneity of pDCs is developmentally encoded.
a–e, BM and splenic pDCs and pDC-like cells, analyzed in Zbtb46gfp/+ mice. a, Two-color histograms for the expression of CD317/SiglecH and CD317/Zbtb46-GFP on BM and splenic pDCs pregated on CD11c+MHCII– cells. BM and splenic pDCs are labeled in red, and pDC-like cells are marked in blue (n = 6 mice, with one representative experiment shown). b, IFN-α, measured from BM and splenic pDCs and pDC-like cells stimulated for 16 h with CpG-A or CpG-B, or left unstimulated (unst.), as indicated (n = 3 independent experiments with 2 technical replicates; each symbol represents a sample, and thin lines represent the mean ± s.e.m.). Expression of Zbtb46-GFP, MHC-II and CD86, determined in BM and splenic pDCs (red) and pDC-like cells (blue) 16 h after CpG-A stimulation. c,d Representative single-color histograms with mean fluorescence intensity (MFI) (c) and the compiled values from BM and splenic cells (d) (n = 3 independent experiments with 2 technical replicates; each symbol represents a sample, and thin lines represent the mean ± s.d.). e, Proliferation of OT-II T cells induced by sort-purified BM and splenic pDCs (red), pDC-like cells (blue) and splenic cDCs (green) (Methods). Cells were cultured in the presence of CpG-A, lipopolysaccharide and OVA-protein for 4 d. T cells stimulated with anti-CD3 and anti-CD28 (gray) were used as controls (n = 3 independent experiments with 2 technical replicates; each symbol represents a sample, and thin lines represent the mean ± s.e.m.). Statistical analysis was done with two-way ANOVA with Tukey post-test (b,d,e). *P < 0.05, **P < 0.01, ***P < 0.001, ****P < 0.0001.

