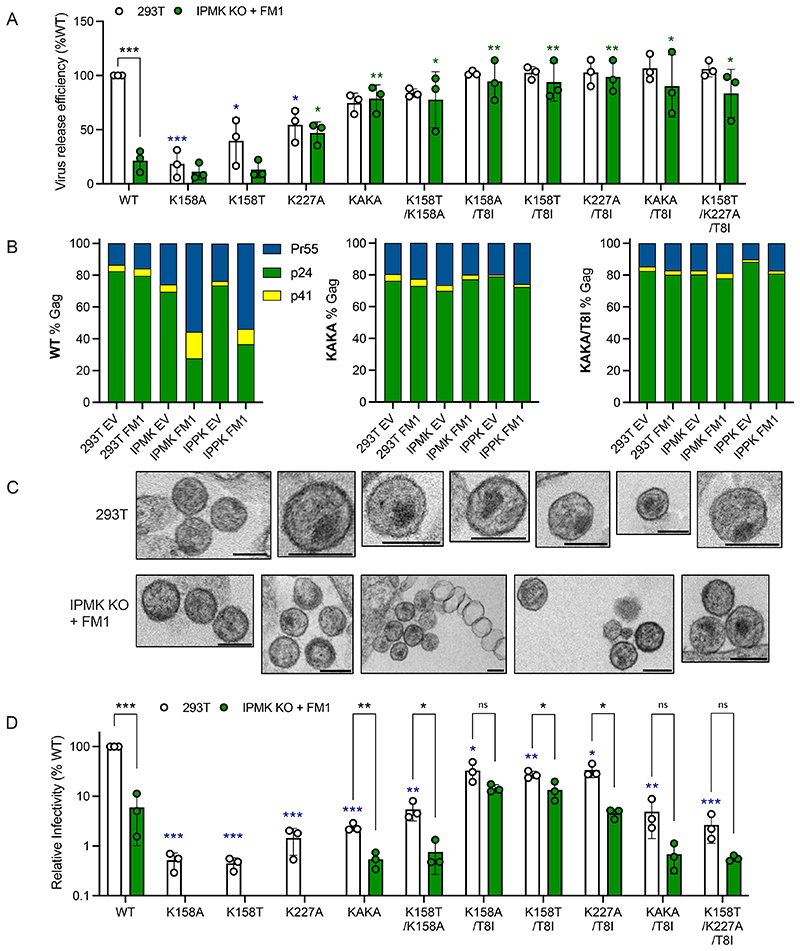
Figure 6. Simultaneously reducing cellular IP6 and the ability of HIV-1 to enrich it into virions amplifies infectivity defects.
(A) Virus release efficiency of Gag mutants from either 293T cells or IPMK KOs overexpressing FM1, calculated as the percentage of particle-associated p24 (CA) as a fraction of total (cell- + particle-associated Gag) normalised to WT virus. Error bars depict the SEM from at least three independent experiments. An unpaired T test was used for statistical analysis and only significant differences indicated [P = 0.05 (*), = 0.005 (**), < 0.0005 (***)]. Blue asterisks refer to significant differences to WT virus produced in 293Ts, whilst green asterisks refer to significant differences to WT virus produced in IPMK KO + FM1 cells. (B) Gag cleavage efficiency of WT, KAKA and KAKA/T8I purified virions, calculated as the relative amount of p24 (CA), p41 and Pr55Gag as a percentage of total Gag. (C) Thin-section electron-microscopy of KAKA mutant HIV-1 virions produced in 293T cells or IPMK KO cells expressing FM1. Scale bar = 120 nm. (D) Infectivity of Gag mutants normalised to the quantity of input virus as determined by RT assay and relative to WT HIV-1. Error bars depict the SEM from three independent experiments. An unpaired T test was used for statistical analysis and significant differences indicated [P = 0.05 (*), = 0.005 (**), < 0.0005 (***)]. Blue asterisks refer to significant differences from WT virus infection of 293Ts.

