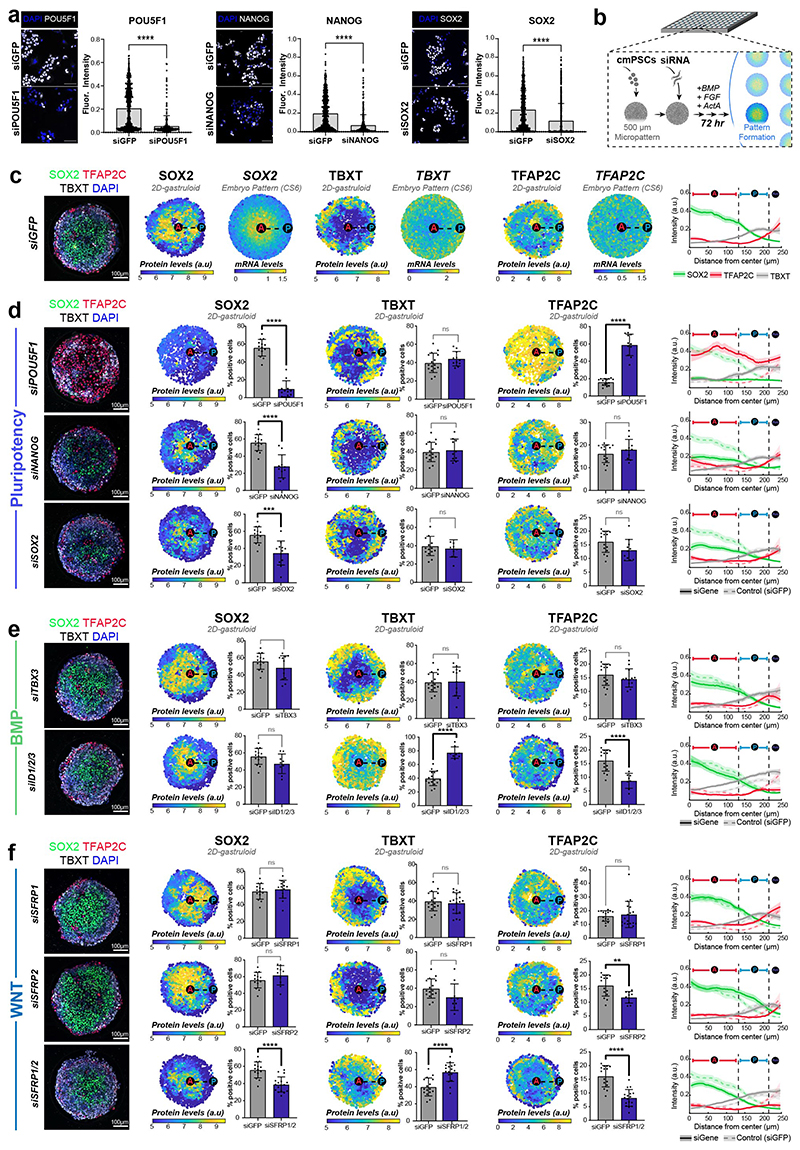
Extended Data Figure 7. siRNA in 2D marmoset gastruloids.
a, siRNA knockdown efficiency. Representative immunofluorescence images (left) and quantification of mean fluorescence intensity (right) 24 hours following transfection with siRNA against POU5F1, SOX2, or NANOG. Comparisons to siGFP (green fluorescent protein) control conducted with two-tailed Mann-Whitney test (****, p<0.0001). siRNA: small interfering RNA
b, Schematic of siRNA screening approach. cmPSCs (common marmoset pluripotent stem cells) were seeded in micropatterned 96-well plates on day -1 and transfected overnight with siRNA. On day 0, media was changed to gastruloid induction media (10 ng/mL FGF + 20 ng/mL Activin A + 50 ng/mL BMP4). 2D-gastruloids were fixed after 72 hours and stained to assess pattern formation.
c, Comparison of siGFP phenotype to in vivo EmDisc patterns. Representative maximum projection immunofluorescence image of siGFP-treated gastruloids differentiated in conventional gastruloid conditions (10 ng/mL FGF + 20 ng/mL Activin A + 50 ng/mL BMP4) for 3 days (left). 2D-gastruloid log expression patterns normalized to maximum intensity plotted for individual channels (SOX2, TBXT, TFAP2C) side by side with virtual embryo pattern of CS6 EmDisc expression patterns generated by Gaussian process regression of anterior-posterior axis expression. Quantification plot (right) shows mean +/- SEM across a minimum of 10 gastruloids with anterior domain (A, SOX2+, TBXT-, TFAP2C-), posterior domain (P, TBXT high), and amnion domain (Am, TFAP2C high, SOX2-) demarcated.
d-f. siRNA knockdown phenotypes of pluripotency factors (siPOU5F1, siNANOG, siSOX2), BMP-related genes (siID1/2/3, siTBX3) and WNT-related genes (siSFRP1, siSFRP2, siSFRP1/2). For each siRNA, a representative maximum projection immunofluorescence is shown (left). Representative expression patterns are plotted for individual channels (SOX2, TBXT, TFAP2C) adjacent to quantification of the percent of nuclei positive for each marker per gastruloid (center). Comparison conducted with two-tailed Mann-Whitney test (ns: not significant; p<0.0332 (*); p <0.0021 (**); p<0.0002,(***); p<0.1; p < 0.0001 (****)).
Quantification plot (right) shows mean +/- SEM across a minimum of 10 gastruloids across 2 wells. SOX2 = green, TFAP2C = red, TBXT = grey. siGFP patterns plotted for comparison in reduced opacity and dashed line with control anterior domain (A, SOX2+, TBXT-, TFAP2C-), posterior domain (P, TBXT high), and amnion domain (Am, TFAP2C high, SOX2-) demarcated.

