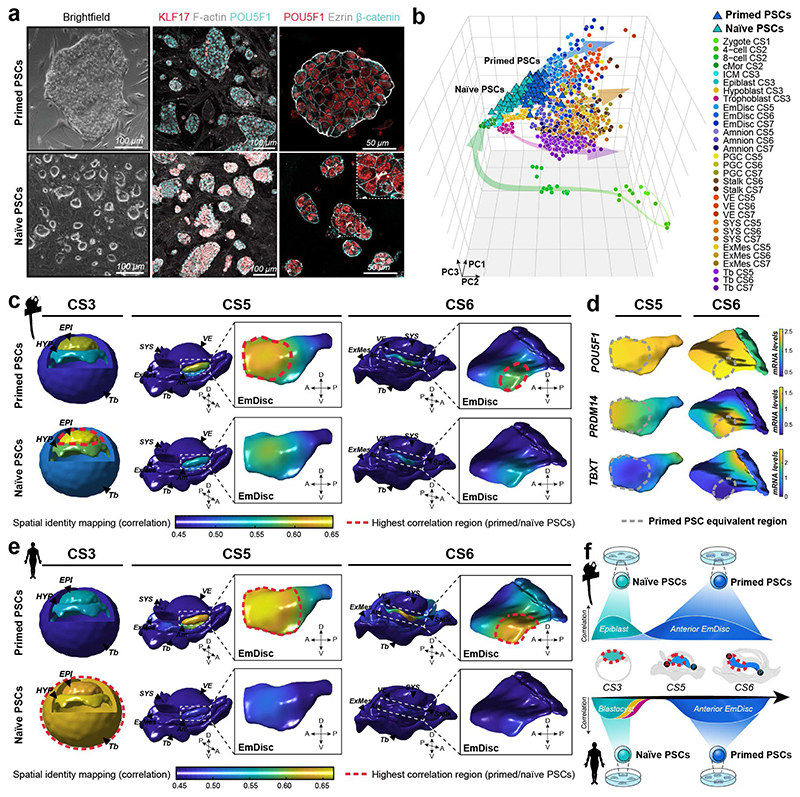
Figure 4. Spatial identity mapping of in vitro cultured cells.
a, Brightfield and immunofluorescence images of primed and naïve marmoset pluripotent stem cells (PSCs) cultured in PLAXA medium. b, Principal component analysis (PCA) of embryonic and extraembryonic cells in vivo and naïve and primed PSCs in vitro. PCA based on the top 2000 most variable genes, PC1=22.0%, PC2 =12.4%, PC3=7.5%. c-e, Spatial identity mapping of marmoset (c) and human (e) naïve and primed PSCs. Colour scale represents projection of correlation values onto embryo model surfaces followed by Gaussian process regression mapping. Blastocyst model is a schematic representation with bulk correlation plotted for each lineage. Gene expression in regions of highest correlations for primed PSCs in the pluripotent anterior indicated by dotted line (d). f, Summary of PSC mapping of marmoset and human PSCs to the marmoset in vivo atlas. A, anterior; P, posterior; D, dorsal; V, ventral; EPI, Epiblast; HYP, Hypoblast; Tb, Trophoblast; EmDisc, Embryonic disc; Am, Amnion; SYS, Secondary Yolk Sac; VE, Visceral Endoderm; ExMes, Extraembryonic mesoderm; PGCs, Primordial Germ Cells.

