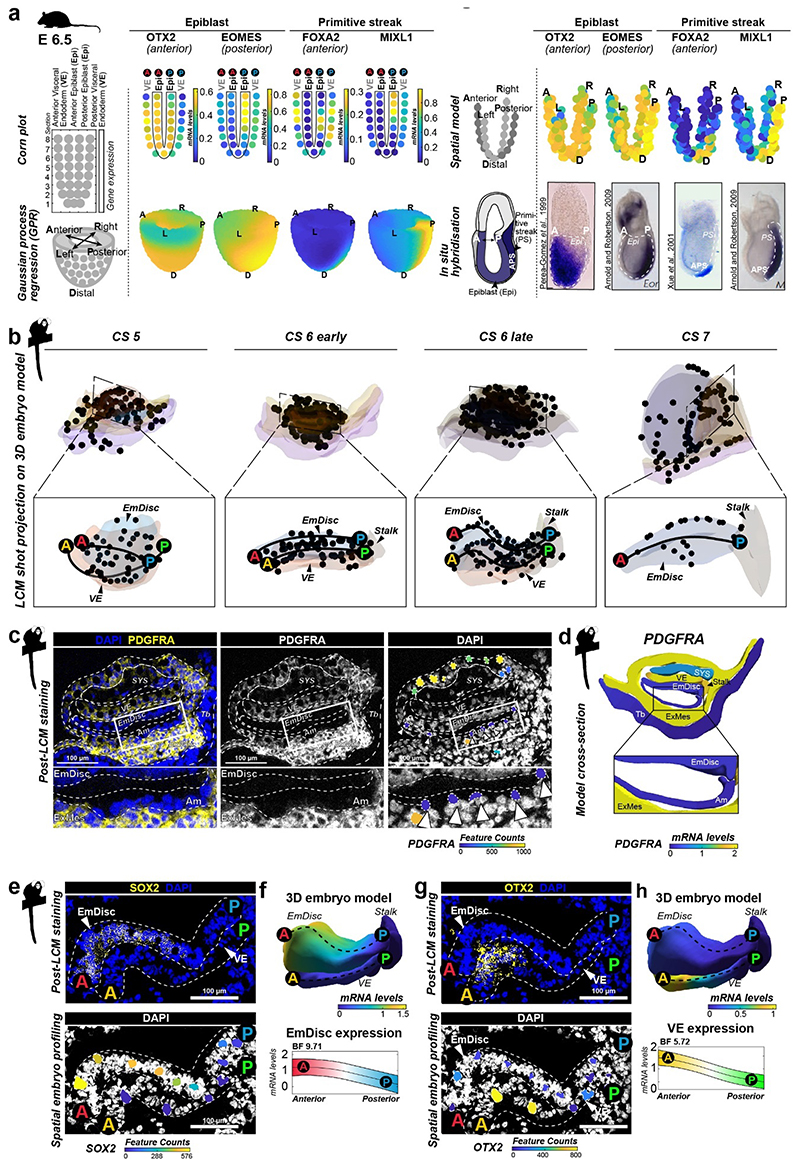
Extended Data Figure 3. Gaussian Process Regression models of spatial transcriptomics in mouse and marmoset embryos.
a, Spatial modelling of mouse postimplantation embryos based on published mouse embryo expression data shown for representative genes markers of anterior/posterior (A/P) epiblast (Epi), primitive streak (PS) and anterior primitive streak (APS). Each kernel on corn plots represents a micro-dissected and sequenced section of the mouse embryo from ref4,5. Corn plots were transformed into spatial models to match anterior-posterior and left-right axis. Gaussian process regression allowed visualisation of gene expression gradients, which were compared to in-situ hybridisation of postimplantation mouse embryos for validation of gaussian process regression approach. Source publication indicated next to individual images.
b, Projection of shots on 3D virtual reconstructions. LCM-samples projected as black dots on 3D virtual models of each developmental stage used for downstream gene expression analysis. EmDisc, Embryonic Disc; VE, Visceral Endoderm; ExMes, Extraembryonic Mesoderm; A, Anterior; P, Posterior.
c-d, Spatial embryo profiling LCM-sample lineage assignment examples. LCM-samples that were spatially close were assigned to amnion or ExMes based on PDGFRA expression. PDGFRA immunostaining of the CS6 early embryo demonstrates that amnion (nuclei adjacent to the amniotic cavity) is PDGFRA-negative (highlighted in inset below). Raw PDGFRA feature counts of individual LCM-samples overlaid on DAPI recapitulate immunostaining pattern, showing high expression in ExMes samples and no expression in amnion samples. LCM-samples from other lineages, that showed mixed lineage identity, or did not pass QC are not displayed. Arrowheads indicate PDGFRA-negative amnion. Cross-section of 3D-model (right) represents gaussian process regression-based modelling of all lineages in CS6 early embryo, recapitulating specific PDGFRA expression pattern observed by immunofluorescence and raw transcriptome data.
e-h, Spatial embryo profiling processing example. Representative example of a CS6 section processed by spatial embryo profiling and immunofluorescence staining for SOX2 (e) and OTX2 (g). Gaussian process regression-based modelling of EmDisc and VE for SOX2 recapitulates the anterior EmDisc expression pattern observed by immunofluorescence and raw transcriptome data (f), and recapitulated anterior expression of OTX2 recapitulates the anterior VE expression pattern observed by immunofluorescence and raw transcriptome data (h). Upper panel: Relative mRNA levels for gene expression across the model. Lower panel: mRNA expression changes along anterior-posterior axis (dashed line, anterior EmDisc (red, A) to posterior EmDisc (blue, P), anterior VE (yellow, A) to posterior VE (green, P)) change along A-P axis quantified by Bayesian factor (BF).

