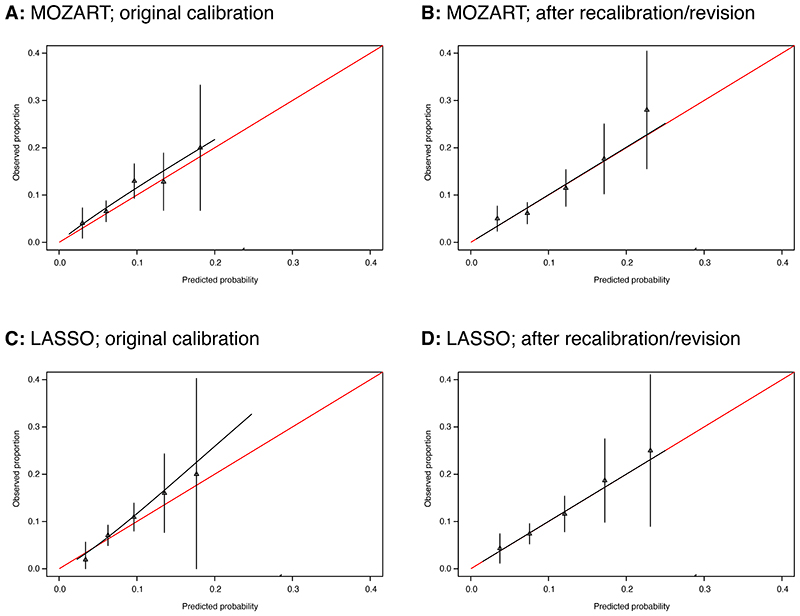
Figure 2. External validation calibration plots for the main models.
Model calibration is the extent to which outcomes predicted by the model are similar to those observed in the validation dataset.
Calibration plots illustrate agreement between observed risk (y axis) and predicted risk (x axis). Perfect agreement would trace the red line. Model calibration is shown by the continuous black line. Triangles denote grouped observations for participants at deciles of predicted risk, with 95% CIs indicated by the vertical black lines. Axes range between 0 and 0.3 since very few individuals received predicted probabilities greater than 0.3.
Panels A and B show external validation calibration plots for the forced-entry model (MOZART); A) shows calibration before, and B) shows calibration after recalibration. Panels C and D show external validation calibration plots for the LASSO model; C) shows calibration before, and D) shows calibration after recalibration.

