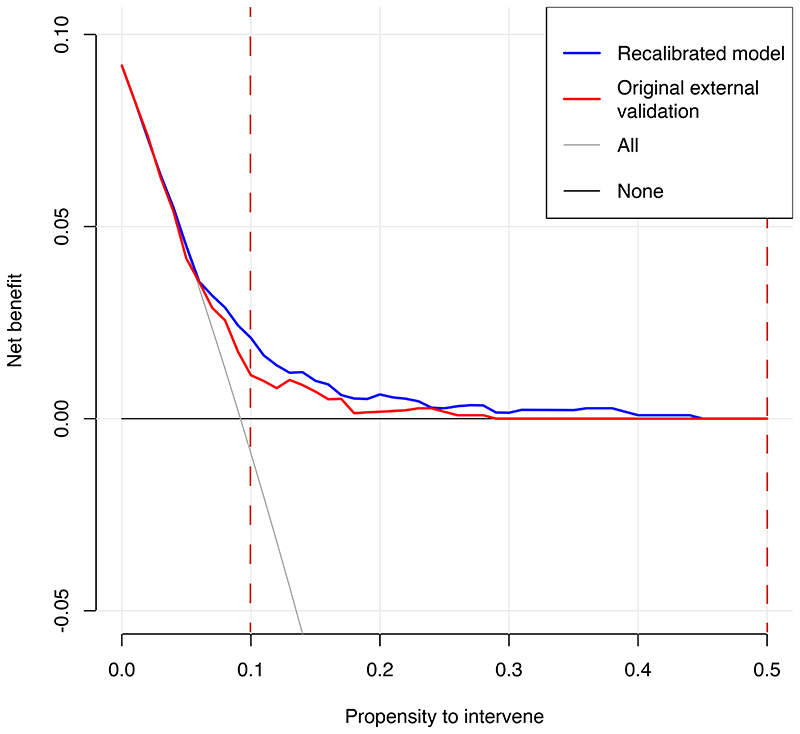
Figure 3. Decision curve analysis plot for forced-entry original and recalibrated models.
The plot reports net benefit (y axis) of forced-entry (MOZART) original and recalibrated models across a range of propensity to intervene thresholds (x axis) compared with intervening in all patients, or intervening in no patients.
The shaded red vertical lines represent the two thresholds we selected a priori to study potential clinical value of low- and high-risk interventions (e.g., monitoring or starting clozapine).

