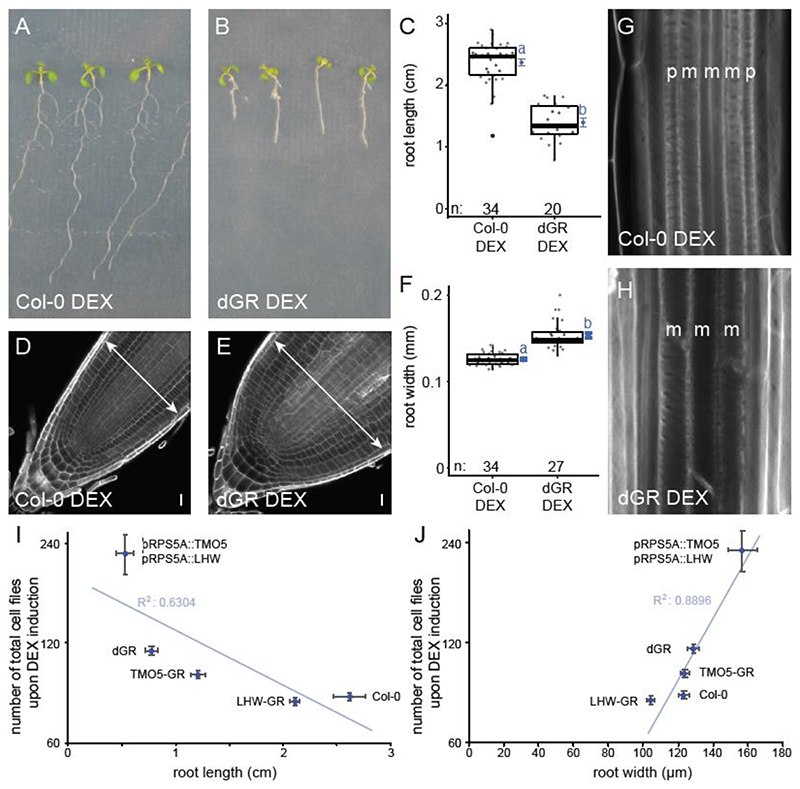
Figure 1. Root phenotype of Col-0 and the dGR line on induced (DEX) media.
(A-B) 1- week-old Col-0 (A) and dGR (B) plants grown on 10 μM DEX. (C) Boxplot of root length of Col-0 and dGR plants grown for 5 days on 10 μM DEX. (D-E) Col-0 (D) and dGR (E) root tips grown on 10 μM DEX. Arrows are highlighting root meristem width. (F) Boxplot of root width of Col-0 and dGR plants grown on 10 μM DEX. Black lines indicates the median and grey boxes indicate data ranges. The mean and its precision are plotted as the blue rhombus with blue SE bars. Blue lower-case letters (compact letter display) at these means in C, F not sharing a letter indicate significantly different groups as determined by one-way ANOVA with post-hoc Tukey testing at 5% significance level. The n marks the number of datapoints for each sample. (G-H) The vascular differentiation phenotype of Col-0 (G) and dGR (H) plants grown on 10 μM DEX. The p and m indicate protoxylem and metaxylem strands respectively. Root width of Col-0 and dGR plants grown for 5 days on 10 μM DEX (n ≥ 20). (I-J) 1-week old seedlings grown on 10 μM DEX (n ≥ 10), were used to plot the number of total cell files in the root meristem against the root length (I) or root width (J). Error bars indicate standard error. Scale bars in D-E indicate 10 μm.

