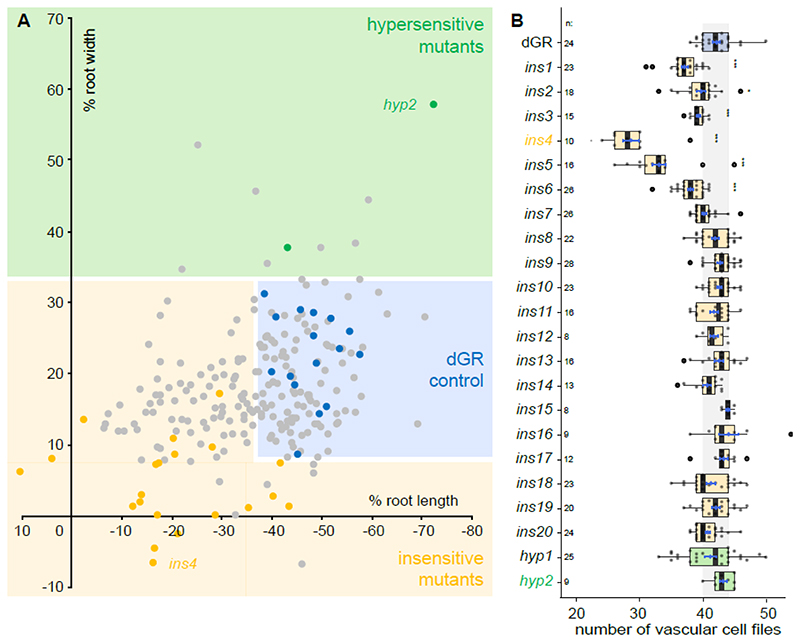
Figure 2. Overview of obtained EMS mutants.
(A) A total overview of all 260 primary selected EMS mutants and several parental dGR lines, plotted for their sensitivity of root length changes against the sensitivity of root width changes relative to mock treatment of the same genotype. Thus, the percentage represent mock vs DEX treatment of each mutant or parental dGR line. Data from the EMS screening was used. Dots in the blue box represent EMS mutants behaving similar to parental dGR control and dots in the yellow box represent mutants that behave insensitive to dGR response (significant longer and/or thinner roots) compared to the dGR parental line, while in the green box mutants behave hypersensitive to dGR induction. Yellow and green dots represent the 22 selected EMS mutants, the yellow dots represent the ins mutants and green dots the hyp mutants. Grey dots represent other EMS mutants selected from the primary screen and blue dots represent non-mutagenized parental dGR. Each data point was compared with a dGR parental control grown on the same plate. This internal control explains why some non-significant EMS mutant lines (grey dots) are further away from the parental dGR (blue dots) then some significant EMS mutant lines (yellow or green dots). For each data point the average was used from 10 biological repeats. (B) Overview vascular cell files phenotype in candidate mutants. Counts of vascular cell files in the root meristem of 1-week-old dGR (blue), ins (yellow) and hyp (green) seedlings. All genotypes described contain the dGR constructs. Black lines indicate the median and boxes indicate data ranges. The mean and its precision are plotted as the blue rhombus with blue SE bars. The n is above the genotype labels indicates number of datapoints for each genotype. Pairwise comparisons with Dunnett method p-value adjustment, was performed to evaluate significant differences between a mutant’s and dGR number of vascular cell files (Table S1). Significances asterisks: * = p-value < 0.05; ** = p-value < 0.01; *** = p-value < 0.001.

