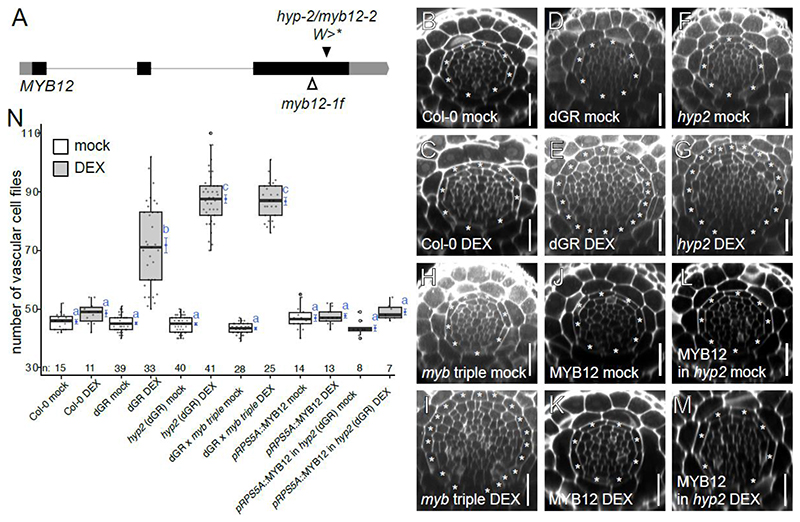
Figure 4. The hyp2 is hypersensitive to dGR response and MYB12 acts as a repressor for TMO5/LHW activity.
(A) MYB12 gene marked with known myb12-1f transposon insertion site and hyp2/myb12-2 point mutation site, which results in premature stop codon. (B-M) Representative root meristem cross-sections of Col-0 on mock (B), Col-0 on DEX (C), dGR on mock (D), dGR on DEX (E), hyp2/myb12-2 (dGR) on mock (F), hyp2/myb12-2 (dGR) on DEX (G), myb11 myb12-1f myb111 triple mutant (referred to as myb triple) (dGR) on mock (H), myb triple (dGR) on DEX (I), pRPS5A::MYB12 on mock (J), pRPS5A::MYB12 on DEX (K), pRPS5A::MYB12 (in myb12-2 (dGR)) line on mock (L) and on DEX (M). The asterisks mark the endodermis cells and counted vascular cell file number are within this cell type. Scale bars are 25 μm. (N) Boxplot plotting the vascular cell file number. Black lines indicates mean values and grey/white boxes indicate data ranges. n marks the number of datapoints for each sample. The mean and it precision are plotted as the blue rhombus with blue SE bars. Count data samples were compared pairwise based estimated means of a generalized linear model with log link function. No shared blue lower-case letters (compact letter display) at these means indicate significantly different groups as determined by the pairwise comparisons (Table S1).

