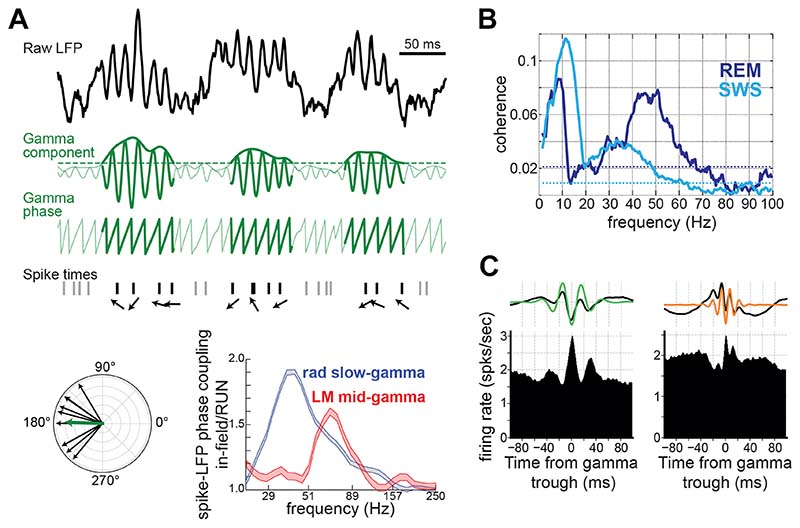
Figure 3. Spiking activity coupling to gamma oscillations.
A) Mean vector length method for coupling quantification. Raw LFPs are filtered for the extraction of a gamma signal, which is then used to compute the instantaneous gamma phase. The distribution of the phases sampled by the spike times of a given neuron is next analyzed in a polar plane, where each spike-sampled phase is represented by a vector (phasor) with that corresponding angle. The more consistent is the firing of the neuron, the more concentrated this distribution is around a given mean phase. Thus, the spike-to-phase coupling is quantified as the length of the mean phasor. Non-coupled neurons produce phasors homogenously distributed around the polar plane that cancel out when averaged, whereas phasors obtained for highly coupled neurons stack up, resulting in larger mean vectors. A threshold might be applied to the instantaneous amplitude of gamma to avoid using spikes when the oscillation is not present in the signal, as shown in this figure. Bottom right panel shows coupling strength (relative measure for spikes inside- over outside of place fields) of CA1 place cells calculated for signals in CA1 strata radiatum and lacunosum-moleculare, estimated by ICA (adapted from 82. Copyright 2010 Society for Neuroscience). B) (Magnitude-Square) Coherence between neocortical LFPs and spike train of a local neuron during REM (darker blue) and slow-wave sleep (lighter blue). These results show how oscillation frequency of the same oscillator, localized near the cell, revealed by spike-LFP coupling, can vary depending on the behavioral state (adapted from 30). C) Spike coupling to different gamma oscillations revealed by time-domain analysis. Top panels show CA1 raw and filtered LFP averaged around slow (left) or mid (right) gamma troughs. Bottom panels show firing rate of CA1 principal cells aligned to the same gamma troughs. Importantly, for this analysis a single trough of gamma is taken per theta cycle. Note that instantaneous rates of these cells oscillate around the trough of each gamma paced by its corresponding rhythm (adapted from 24).

