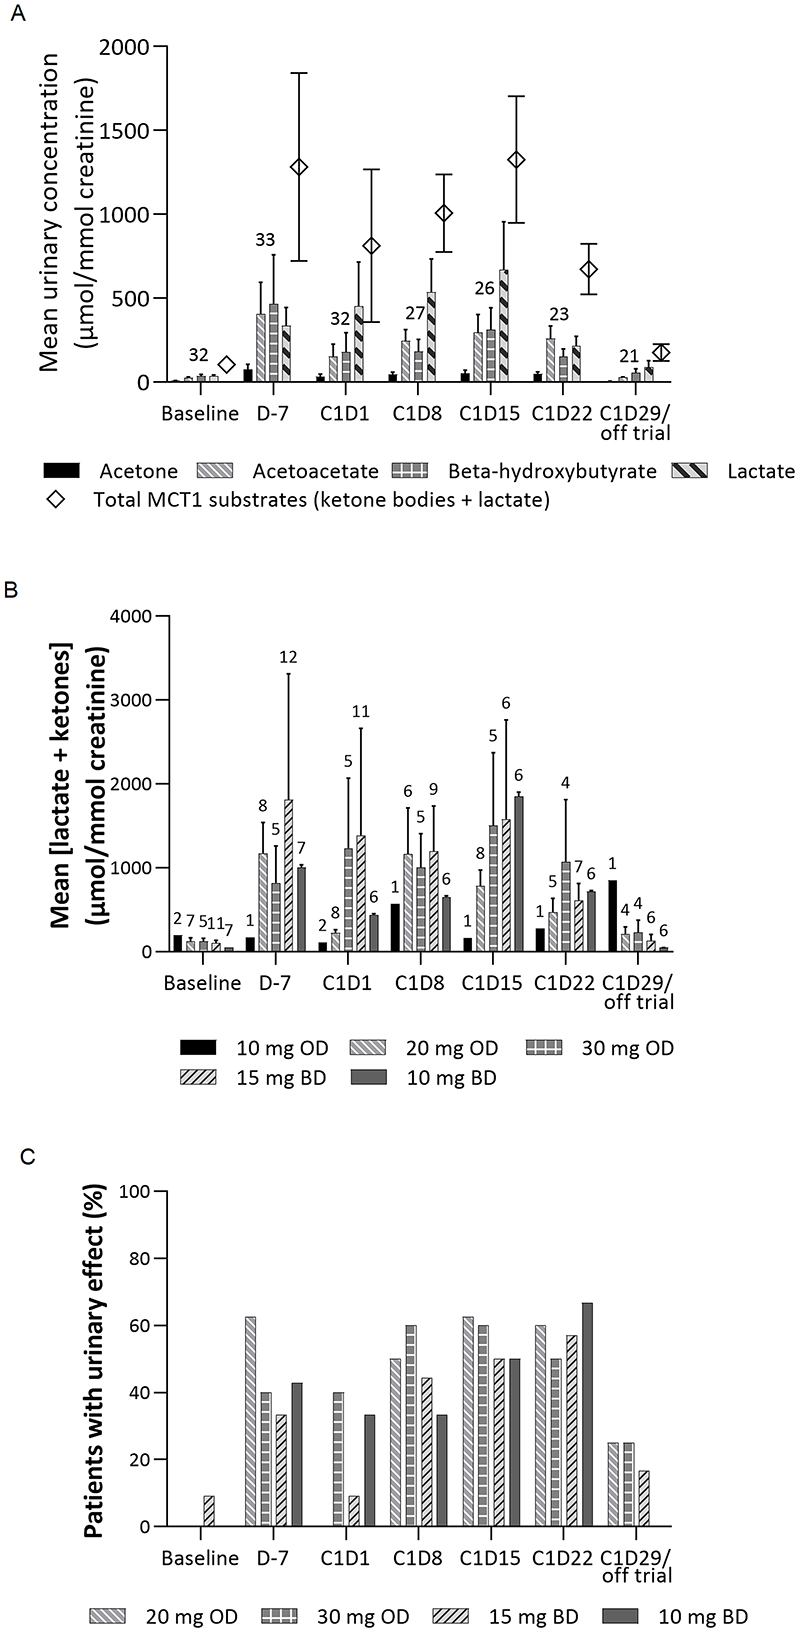
Figure 3. Average Urinary Metabolite Excretion (A) Over Time Across All Patients, (B) of Total MCT1 Substrates Over Time Across All Patients by Cohort, and (C) Effect Rates at Each Timepoint According to Urinary Metabolite Excretion Across Cohorts 3–6.
Number of patients for each analysis shown in numerals above relevant bars in panels (A) and (B); the analysis population for panel (C) is the same as for panel (B). Urinary effect defined as 5×median urinary concentration of total MCT1 substrates (lactate and ketone bodies) across all patients at baseline (463.9 μmol/mmol creatinine).
Abbreviations: BD, twice daily; C, cycle; D, day; MCT, monocarboxylate transporter; OD, once daily.

