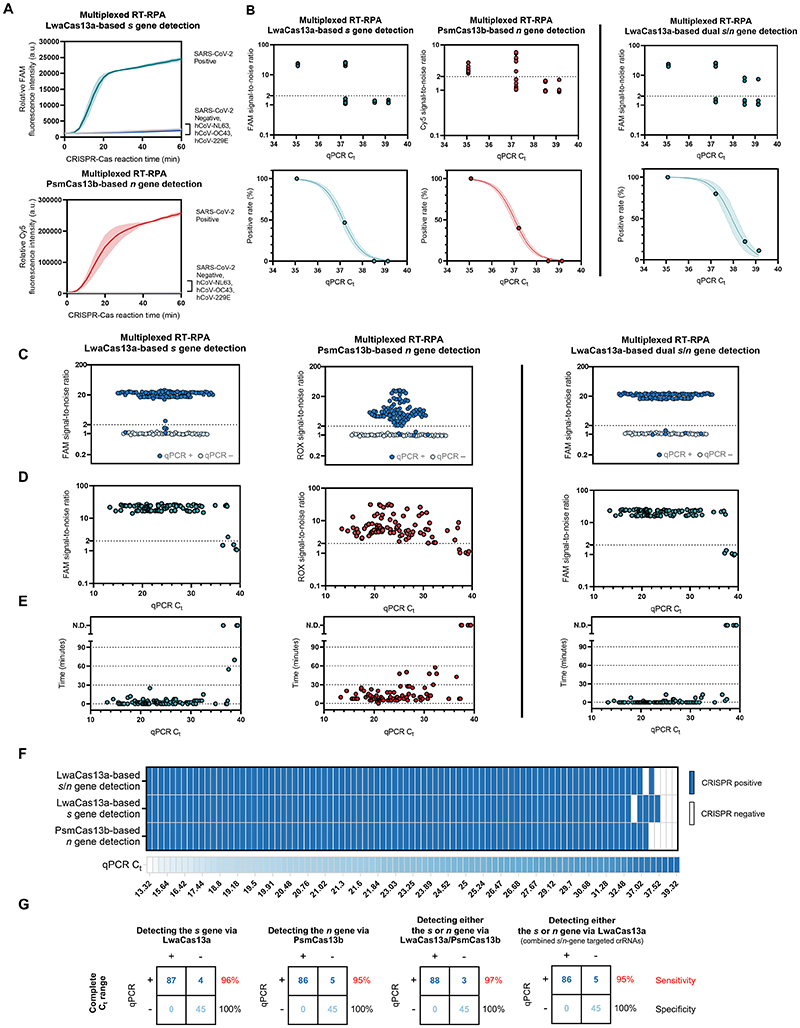
Figure 2. Specificity and sensitivity of the multiplexed CRISPR-based detection of SARS-CoV-2 RNA.
(A) Clinical specificity. Kinetics of FAM (top) and Cy5 (bottom) fluorescence signal generation from the SARS-CoV-2 s (top) and n gene (bottom) detection via a multiplexed CRISPR-Cas reaction, using RNA extracts from clinical samples verified to be positive with different coronaviruses via RT-qPCR. The SARS-CoV-2 negative sample is an extract from a clinical sample confirmed to be SARS-CoV-2-negative by RT-qPCR. Data are mean ± s.d. from 3 replicates. (B) The limit of detection. Multiplexed RT-RPA followed by multiplexed Cas-based detection were performed with serially diluted SARS-CoV-2 RNA, whose Ct values were determined using a Luna one-step RT-qPCR assay targeting the n gene of SARS-CoV-2. At least three independent replicates of the amplification/detection reactions were performed for each SARS-CoV-2 RNA dilution. Top: signal-to-noises (S/N) of FAM (from LwaCas13a-mediated s gene detection) and Cy5 (from PsmCas13b-mediated n gene detection) fluorescence intensities are shown. The S/N threshold for a positive result was set at 2. Noise is defined as the fluorescence intensity generated from a negative sample with water as input performed in parallel. Bottom: positive rates of the detection of the s and n genes from multiplexed CRISPR-based detection at different SARS-CoV-2 RNA input concentrations. (C)-(G), clinical sensitivity. (C) Summary of S/N obtained from multiplexed CRISPR-based detection results on 136 clinical samples (91 are COVID-19-positive by RT-qPCR; 45 are negative). (D) Relation of S/N obtained from multiplexed CRISPR-based detection to Ct values of COVID-19-positive samples. (E) Time to positive CRISPR detection results vs Ct values of COVID-19-positive samples. (F) Results of multiplexed CRISPR-based detection for 91 COVID-19-positive samples ordered by Ct values from RT-qPCR. (G) Concordance between RT-qPCR and multiplexed CRISPR-based detection of SARS-CoV-2 RNA. On the right of each concordance box, sensitivity values (%) for the detection of the s and n genes under a given scheme are shown in red; specificity values (%) are shown in black.

