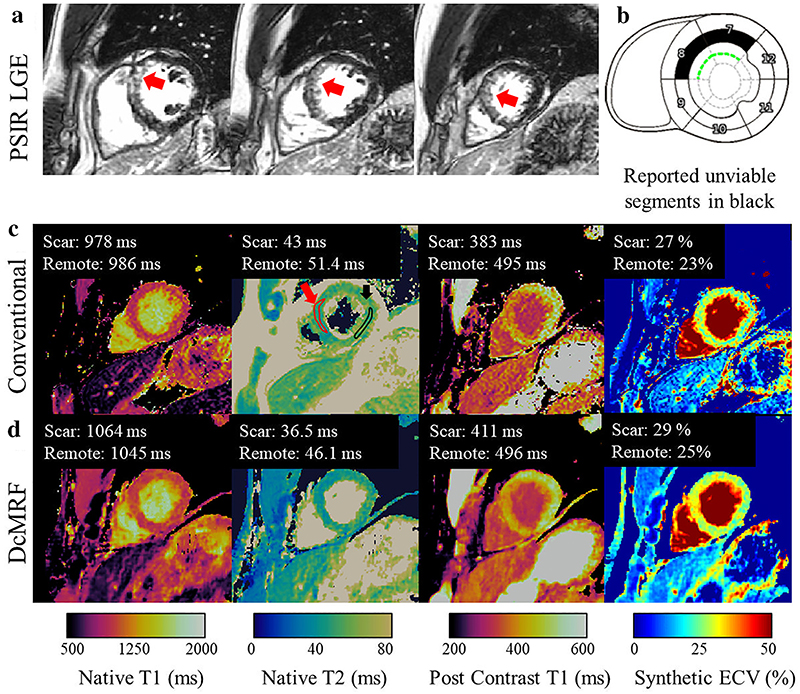
Figure 3. Patient with subendocardial chronic infarct.
(a) Phase-sensitive inversion recovery late gadolinium enhanced (PSIR LGE) images showing infarct (red arrow). (b) Diagram of reported unviable segments (c) conventional maps (d) cardiac MRF maps. Example ROIs drawn in the scar (red) and remote (black) areas are shown on the conventional T2 map (c). Water T1 (pre- and post-contrast), water T2, and synthetic ECV cardiac MRF values are in good agreement with conventional measurements. MRF = Magnetic Resonance Fingerprinting. ROI = Region of Interest. ECV = extracellular volume. As originally published by Wiley in Jaubert et al. Journal of Magnetic Resonance Imaging. 2021;53(4):126252

