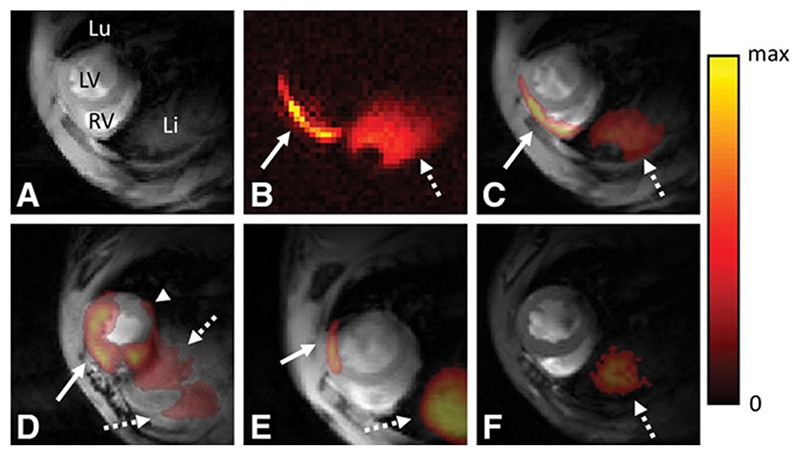
Figure 6. In vivo fluorine-19 (19F)-cardiovascular magnetic resonance (CMR) of myocarditis.
A, 1H CMR slice in the short-axis orientation at the base of the heart of a mouse with disease score 3; 1H CMR depicts the right and left ventricles (RV and LV) as well as the lung (Lu) and liver (Li). B, 19F-CMR of the same anatomic location. Two regions with a 19F signal can be observed: a thin line at the level of the myocardium (solid arrow) and a larger region at the level of the liver (dotted arrow). The color coding for 19F signal intensity is given to the right (in arbitrary units). C, Fusion of the 1H (A) and 19F images (B): the 19F signal colocalizes with the subepicardial layer of the LV anterior wall, the RV free wall (arrow) and the liver (dotted arrow). D, A similar fused basal slice in an animal with disease score 4. Here, the 19F signal is spread over the majority of the ventricles with a subepicardial 19F signal in the inferior wall of the LV (arrow head). E, Animal with disease score 2 with a relatively small patch of 19F signal (arrow). F, Healthy control, in which a 19F signal can only be observed in the liver (dotted arrow). As originally published by Wolters Kluwer Health, Inc in van Heeswijk et al. Circ Cardiovasc Imaging. 2013;6(2):280 82

