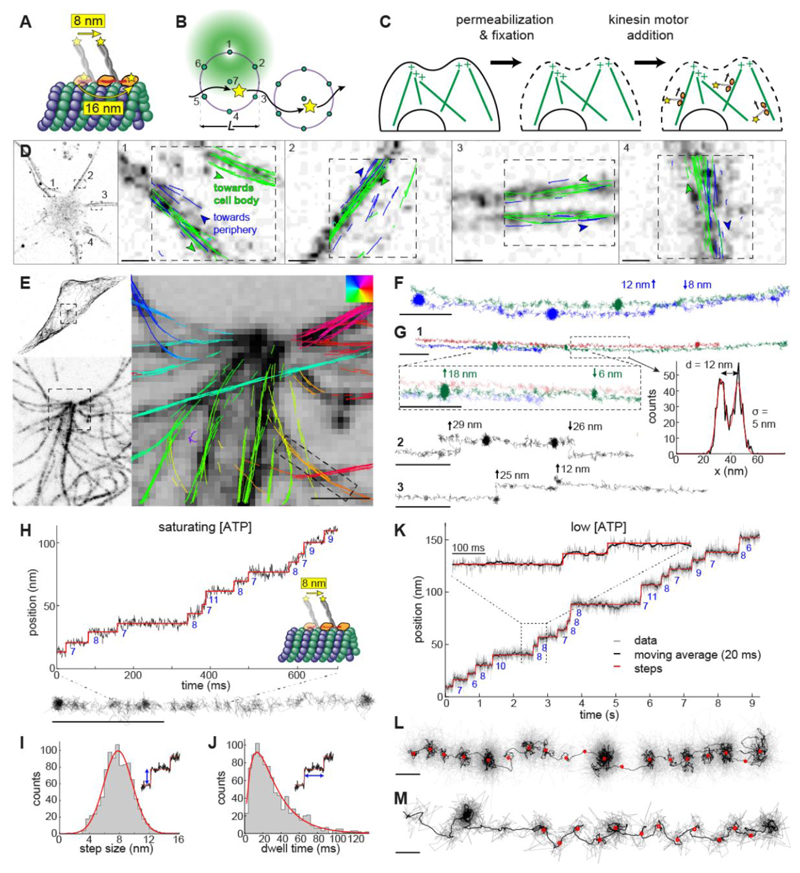
Figure 1. MINFLUX tracking of kinesin-1 in fixed cells.
(A) Kinesin-1 walks on microtubules (MTs) in a hand-over-hand manner. The apparent step size is 8 nm when the label is attached to the C-terminal tail domain and 16 nm when it is attached to the N-terminal motor domain. (B) 2D MINFLUX tracking of a single molecule. A donut beam probes seven positions around a fluorophore to determine its location with nanometer precision. The scan pattern is iteratively centered on the fluorophore during tracking. (C) Motor-PAINT approach to track kinesin in fixed cells. Cells are first permeabilized to extract cell contents and then gently fixed to preserve MTs. Purified fluorescently labeled kinesins (DmKHC (1-421)-SNAP-tag-6xHis) are added and tracked as they walk towards the plus-ends of the MTs (movie S1). (D – M) MINFLUX motor-PAINT in fixed cells. (D) Confocal images of a neuron and overlaid kinesin trajectories in four neurites. Most of the neurites show kinesin trajectories in both directions, i.e. towards (green) and away (blue) from the soma, as expected for dendrites. (E) Confocal microscopy images of GFP-α-tubulin in U2OS cells showing what appears to be a centrosome and overlaid kinesin trajectories with color-coded walking directions. (F) Tracks as indicated in (E) show side-stepping. (G) Tracks as close as 12 nm are clearly resolved and display kinesin switching laterally between neighboring MTs or protofilaments (movie S2). (H) Representative track and the corresponding time versus position plot at saturating ATP concentrations (>1 mM, here 6 mM), showing 8 nm walking steps. (I) Histogram of step size at saturating ATP concentrations from 7 experiments, 49 tracks, and 956 steps and Gaussian fit (7.8 nm ± 2.7 (std) ± 0.09 nm (sem); red line). (J) Dwell time histogram and fit with a convolution of two exponential functions (average dwell time of 30.8 ms; red line). (K, L and movie S3) A representative track at low ATP concentrations (10 μΜ) and a corresponding time versus position, raw data (gray), and 20 ms running mean (black), clearly showing 8 nm walking steps. (M, fig. S2A, E and movie S4) A representative track showing a zigzag trajectory, indicating an asymmetric arrangement of the label within a kinesin molecule (see fig. S3 for additional examples). Scale bars: 10 nm (L, M), 100 nm (F, G, H), 1 μm (D, E).

