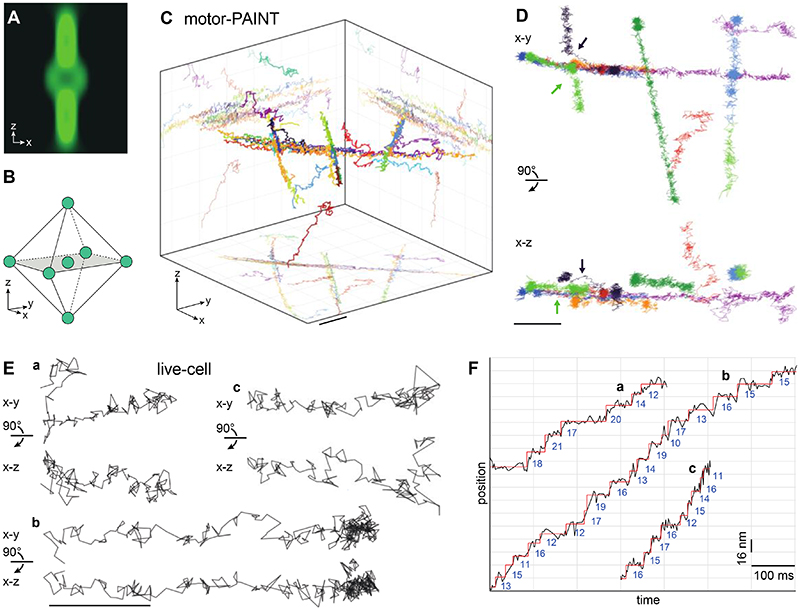
Figure 3. 3D MINFLUX tracking of kinesin-1.
(A, B) 3D MINFLUX tracking. (A) A 3D donut beam probes the intensity at (B) seven three-dimensionally distributed positions around a fluorophore. (C, D) 3D tracking with motor-PAINT in fixed U2OS cells. (C) 3D rendering of kinesin-1 tracks at crossing MTs with a volumetric size of 1.2 μm × 1.2 μm × 1 μm. (D) Selected tracks from (C) in top and side views, including ascending and descending trajectories, and two trajectories in which motors switch MTs (arrows). (E, F) 3D tracking in live cells. (E) Representative kinesin-1 tracks in live U2OS cells in top and side views, showing stepwise movements both in the x-y plane and along the z-axis (see fig. S2D, H for histograms, fig. S9 confocal overview images and movie S10). (F) Position versus time plots of the tracks from (E), showing 16 nm steps. Scale bars: 100 nm (E), 200 nm (C, D).

